Primerica, Inc. (PRI): Price and Financial Metrics
GET POWR RATINGS... FREE!
PRI POWR Grades
- Stability is the dimension where PRI ranks best; there it ranks ahead of 78.62% of US stocks.
- PRI's strongest trending metric is Momentum; it's been moving up over the last 179 days.
- PRI's current lowest rank is in the Value metric (where it is better than 26.96% of US stocks).
PRI Stock Summary
- PRI's one year PEG ratio, measuring expected growth in earnings next year relative to current common stock price is 1,020.36 -- higher than 96.91% of US-listed equities with positive expected earnings growth.
- Equity multiplier, or assets relative to shareholders' equity, comes in at 7.75 for Primerica Inc; that's greater than it is for 86.44% of US stocks.
- With a year-over-year growth in debt of 54.73%, Primerica Inc's debt growth rate surpasses 84.46% of about US stocks.
- Stocks with similar financial metrics, market capitalization, and price volatility to Primerica Inc are INDB, TDS, UHS, SFBC, and AWR.
- PRI's SEC filings can be seen here. And to visit Primerica Inc's official web site, go to www.primerica.com.
PRI Valuation Summary
- PRI's price/sales ratio is 2.4; this is 25% lower than that of the median Financial Services stock.
- PRI's price/sales ratio has moved up 1.7 over the prior 139 months.
- Over the past 139 months, PRI's EV/EBIT ratio has gone up 8.3.
Below are key valuation metrics over time for PRI.
Stock | Date | P/S | P/B | P/E | EV/EBIT |
---|---|---|---|---|---|
PRI | 2021-08-04 | 2.5 | 3.0 | 13.9 | 10.0 |
PRI | 2020-02-24 | 2.6 | 3.3 | 14.6 | 11.1 |
PRI | 2019-01-11 | 2.4 | 3.1 | 10.9 | 10.3 |
PRI | 2018-12-26 | 2.3 | 2.9 | 10.3 | 9.7 |
PRI | 2016-05-02 | 1.7 | 2.1 | 12.6 | 8.1 |
PRI | 2011-07-19 | 1.5 | 1.1 | 9.4 | 6.1 |
PRI Growth Metrics
- Its year over year cash and equivalents growth rate is now at 61.1%.
- Its 4 year net cashflow from operations growth rate is now at 141.92%.
- Its 4 year net income to common stockholders growth rate is now at 87.69%.

The table below shows PRI's growth in key financial areas (numbers in millions of US dollars).
Date | Revenue | Operating Cash Flow | Net Income to Common Stock |
---|---|---|---|
2021-12-31 | 2,709.732 | 656.956 | 373.357 |
2021-09-30 | 2,583.964 | 674.585 | 438.574 |
2021-06-30 | 2,459.186 | 601.785 | 438.219 |
2021-03-31 | 2,330.315 | 631.353 | 411.567 |
2020-12-31 | 2,217.541 | 643.417 | 386.164 |
2020-09-30 | 2,151.171 | 568.135 | 379.637 |
PRI's Quality Factors
The “Quality” component of the POWR Ratings focuses on 31 different factors of a companies fundamentals and operational strength. Here are some key insights as we drill into the specifics of these quality attributes.- PRI has a Quality Grade of C, ranking ahead of 59.52% of graded US stocks.
- PRI's asset turnover comes in at 0.164 -- ranking 96th of 133 Insurance stocks.
- UIHC, TRUP, and AJG are the stocks whose asset turnover ratios are most correlated with PRI.
The table below shows PRI's key quality metrics over time.
Period | Asset Turnover | Gross Margin | ROIC |
---|---|---|---|
2021-06-30 | 0.164 | 0.718 | 0.041 |
2021-03-31 | 0.160 | 0.715 | 0.039 |
2020-12-31 | 0.157 | 0.722 | 0.038 |
2020-09-30 | 0.156 | 0.739 | 0.038 |
2020-06-30 | 0.155 | 0.748 | 0.037 |
2020-03-31 | 0.155 | 0.757 | 0.037 |
PRI Price Target
For more insight on analysts targets of PRI, see our PRI price target page. And for a list of of all stocks sorted by upside potential based on analyst target price, see our Top Price Target page.
Average Price Target | $181.25 | Average Broker Recommendation | 1.5 (Moderate Buy) |
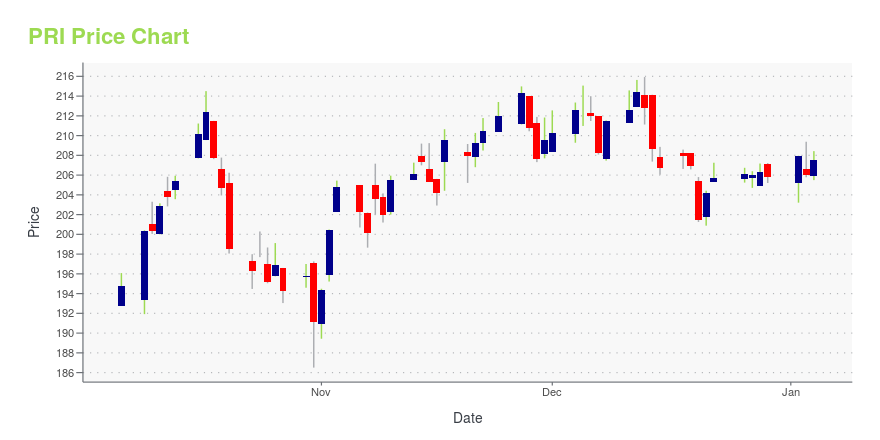
PRI Stock Price Chart Interactive Chart >
PRI Price/Volume Stats
Current price | $117.61 | 52-week high | $179.51 |
Prev. close | $118.95 | 52-week low | $110.22 |
Day low | $116.91 | Volume | 1,116 |
Day high | $118.35 | Avg. volume | 184,679 |
50-day MA | $123.59 | Dividend yield | 1.85% |
200-day MA | $142.74 | Market Cap | 4.58B |
Primerica, Inc. (PRI) Company Bio
Primerica distributes financial products to middle income households in the United States and Canada. The company operates in three segments: Term Life Insurance; Investment and Savings Products; and Corporate and Other Distributed Products. The company was founded in 1977 and is based in Duluth, Georgia.
Latest PRI News From Around the Web
Below are the latest news stories about Primerica Inc that investors may wish to consider to help them evaluate PRI as an investment opportunity.
Primerica Consensus Indicates Potential 30.6% UpsidePrimerica found using ticker (PRI) now have 6 analysts in total covering the stock. The consensus rating is ''Buy''. The range between the high target price and low target price is between 199 and 160 calculating the mean target price we have 177.33. Given that the stocks previous close was at 135.82 this would indicate that there is a potential upside of 30.6%. There is a 50 day moving average of 151.38 and the 200 day moving average is 154.09. The market cap for the company is $5,323m. Visit the company website at: https://www.primerica.com [stock_market_widget type="chart" template="basic" color="green" assets=PRI" range="6mo" interval="1d" axes="true" cursor="true" api="yf"] The potential market cap would be $6,949m based on the market concensus. Primerica, together with its subsidi... |
Aggressive Investors Could Like SoFi Stock While Its ETFs Offer AlternativeSoFi Technologies continues to add new products such as ETFs for its 2.9 million members. |
Where Primerica Stands With AnalystsAnalysts have provided the following ratings for Primerica (NYSE: PRI ) within the last quarter: Bullish Somewhat Bullish Indifferent Somewhat Bearish Bearish Total Ratings 0 2 2 0 0 Last 30D 0 1 0 0 0 1M Ago 0 0 2 0 0 2M Ago 0 1 0 0 0 3M Ago 0 0 0 0 0 These 4 analysts have an average price target of $169.5 versus the current price of Primerica at $137.525, implying upside. Below is a summary of how these 4 analysts rated Primerica over the past 3 months. The greater the number of bullish ratings, the more positive analysts are on the stock and the greater the number of bearish … Full story available on Benzinga.com |
Expert Ratings For PrimericaPrimerica (NYSE: PRI ) has observed the following analyst ratings within the last quarter: Bullish Somewhat Bullish Indifferent Somewhat Bearish Bearish Total Ratings 0 2 2 0 0 Last 30D 0 1 0 0 0 1M Ago 0 0 2 0 0 2M Ago 0 1 0 0 0 3M Ago 0 0 0 0 0 In the last 3 months, 4 analysts have offered 12-month price targets for Primerica. The company has an average price target of $169.5 with a high of $180.00 and a low of $160.00. Below is a summary of how these 4 analysts rated Primerica over the past 3 months. The greater the … Full story available on Benzinga.com |
Primerica, Inc. (PRI) CEO Glenn Williams On Q4 2021 Results - Earnings Call TranscriptNo summary available. |
PRI Price Returns
1-mo | -6.66% |
3-mo | -15.36% |
6-mo | -22.61% |
1-year | -22.08% |
3-year | -0.74% |
5-year | 64.63% |
YTD | -22.61% |
2021 | 15.86% |
2020 | 3.91% |
2019 | 35.11% |
2018 | -2.88% |
2017 | 48.22% |
PRI Dividends
Ex-Dividend Date | Type | Payout Amount | Change | ||||||
---|---|---|---|---|---|---|---|---|---|
Loading, please wait... |
Continue Researching PRI
Want to see what other sources are saying about Primerica Inc's financials and stock price? Try the links below:Primerica Inc (PRI) Stock Price | Nasdaq
Primerica Inc (PRI) Stock Quote, History and News - Yahoo Finance
Primerica Inc (PRI) Stock Price and Basic Information | MarketWatch
Loading social stream, please wait...