
Procaps Group, S.A. (PROC): Price and Financial Metrics
PROC Price/Volume Stats
| Current price | $2.46 | 52-week high | $4.95 |
| Prev. close | $2.55 | 52-week low | $1.95 |
| Day low | $2.46 | Volume | 628 |
| Day high | $2.46 | Avg. volume | 13,458 |
| 50-day MA | $2.60 | Dividend yield | N/A |
| 200-day MA | $3.01 | Market Cap | 277.54M |
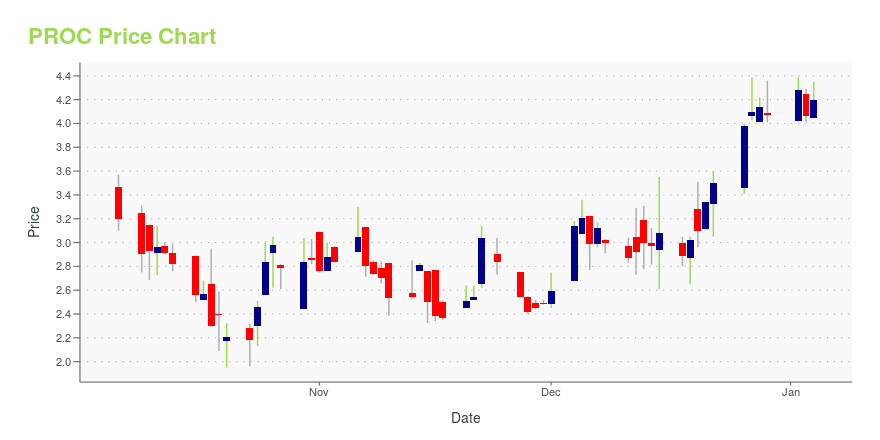
PROC Stock Price Chart Interactive Chart >
Procaps Group, S.A. (PROC) Company Bio
Procaps Group, S.A. develops, manufactures, and markets over-the-counter (OTC) and prescription drugs, nutritional supplements, and clinical solutions. It operates in 13 countries in Latin America. The company was founded in 1977 and is based in Luxembourg City, Luxembourg
Latest PROC News From Around the Web
Below are the latest news stories about PROCAPS GROUP SA that investors may wish to consider to help them evaluate PROC as an investment opportunity.
PROC Stock Earnings: Procaps Gr Beats EPS, Beats Revenue for Q3 2023PROC stock results show that Procaps Gr beat analyst estimates for earnings per share and beat on revenue for the third quarter of 2023. |
Procaps Group Reports Third Quarter 2023 ResultsMIAMI & BARRANQUILLA, Colombia, December 26, 2023--Procaps Group Reports Third Quarter 2023 Results |
Statement from the Board of Directors of Procaps GroupMIAMI & BARRANQUILLA, Colombia, December 21, 2023--Statement from the Board of Directors of Procaps Group |
Procaps Group and Genomma Lab Announce a Strategic Agreement to Manufacture and Market Softgel Products in Latin AmericaProcaps Group (NASDAQ: PROC) ("Procaps"), a leading integrated international healthcare and pharmaceutical services company, and Genomma Lab Internacional, S.A.B. de C.V. (BMV: LABB; "Genomma"), the leading pharmaceutical and personal care company in Latin America, today announced a strategic agreement to develop, manufacture and market five Softgel products within Latin America. Through the partnership, Procaps will manufacture and Genomma will market and distribute the products. |
Procaps Group Announces Appointment of Jose Antonio Vieira as Chief Executive Officer Starting 2024MIAMI & BARRANQUILLA, Colombia, November 22, 2023--Procaps Group Announces Appointment of Jose Antonio Vieira as Chief Executive Officer Starting 2024 |
PROC Price Returns
| 1-mo | -1.99% |
| 3-mo | N/A |
| 6-mo | -40.29% |
| 1-year | -37.08% |
| 3-year | N/A |
| 5-year | N/A |
| YTD | -39.56% |
| 2023 | -22.48% |
| 2022 | -46.15% |
| 2021 | N/A |
| 2020 | N/A |
| 2019 | N/A |
Loading social stream, please wait...