
PureTech Health PLC (PRTC): Price and Financial Metrics
PRTC Price/Volume Stats
| Current price | $22.51 | 52-week high | $34.00 |
| Prev. close | $22.40 | 52-week low | $17.08 |
| Day low | $22.51 | Volume | 1,709 |
| Day high | $22.51 | Avg. volume | 3,286 |
| 50-day MA | $26.12 | Dividend yield | N/A |
| 200-day MA | $24.83 | Market Cap | 538.71M |
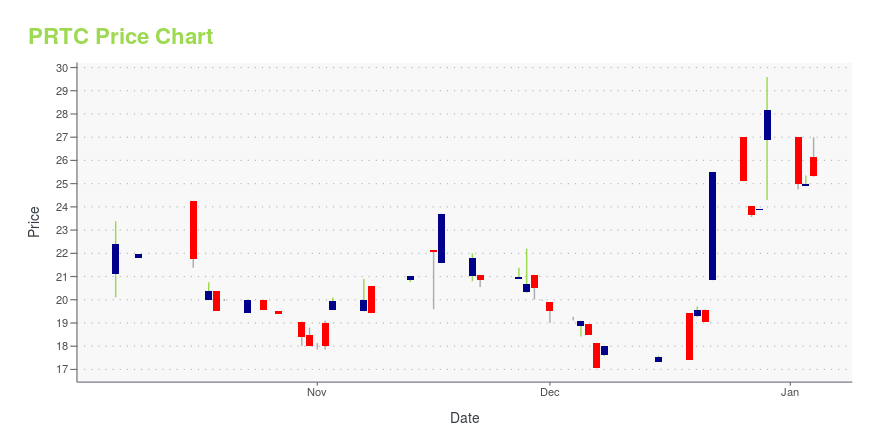
PRTC Stock Price Chart Interactive Chart >
PureTech Health PLC (PRTC) Company Bio
PureTech Health PLC operates as a bio therapeutics company. The Company focuses on developing medicines for diseases based on insights into the biology and connectivity of the brain, immune, and gut systems. PureTech Health established the underlying programs and platforms that resulted in its broad pipeline of products and product candidates designed to treat diseases with unmet needs.
Latest PRTC News From Around the Web
Below are the latest news stories about PURETECH HEALTH PLC that investors may wish to consider to help them evaluate PRTC as an investment opportunity.
PureTech Founded Entity Karuna Therapeutics to be Acquired by Bristol Myers Squibb for $14 BillionBOSTON, December 22, 2023--PureTech Founded Entity Karuna Therapeutics to be Acquired by Bristol Myers Squibb for $14 Billion |
PureTech Year End Update and Outlook for 2024BOSTON, December 20, 2023--PureTech Year End Update and Outlook for 2024 |
PureTech Presents Data from Phase 1 Trial of LYT-200 Targeting Galectin-9 in Solid Tumors at the ESMO Immuno-Oncology Congress 2023BOSTON, December 07, 2023--PureTech Presents Data from Phase 1 Trial of LYT-200 Targeting Galectin-9 in Solid Tumors at the ESMO Immuno-Oncology Congress 2023 |
PureTech Founded Entity Karuna Therapeutics Announces U.S. Food and Drug Administration Accepts New Drug Application for KarXT for the Treatment of SchizophreniaBOSTON, November 29, 2023--PureTech Health plc (Nasdaq: PRTC, LSE: PRTC) ("PureTech" or the "Company"), a clinical-stage biotherapeutics company, noted today that its Founded Entity, Karuna Therapeutics, Inc. (Nasdaq: KRTX) ("Karuna") announced the U.S. Food and Drug Administration (FDA) has accepted its New Drug Application (NDA) for KarXT (xanomeline-trospium) for the treatment of schizophrenia in adults. The application has been granted a Prescription Drug User Fee Act (PDUFA) date of Septemb |
PureTech Founded Entity Karuna Therapeutics Announces Positive Results from Phase 1b Ambulatory Blood Pressure Monitoring Trial of KarXT in SchizophreniaBOSTON, November 17, 2023--PureTech Founded Entity Karuna Therapeutics Announces Positive Results from Ph 1b Ambulatory Blood Pressure Monitoring Trial of KarXT in Schizophrenia |
PRTC Price Returns
| 1-mo | -5.34% |
| 3-mo | -21.02% |
| 6-mo | -12.17% |
| 1-year | N/A |
| 3-year | N/A |
| 5-year | N/A |
| YTD | -20.12% |
| 2023 | -11.66% |
| 2022 | -13.78% |
| 2021 | N/A |
| 2020 | N/A |
| 2019 | N/A |
Loading social stream, please wait...