CarParts.com Inc. (PRTS): Price and Financial Metrics
PRTS Price/Volume Stats
Current price | $4.02 | 52-week high | $7.44 |
Prev. close | $4.09 | 52-week low | $3.80 |
Day low | $4.00 | Volume | 278,500 |
Day high | $4.12 | Avg. volume | 692,524 |
50-day MA | $4.47 | Dividend yield | N/A |
200-day MA | $5.19 | Market Cap | 229.21M |
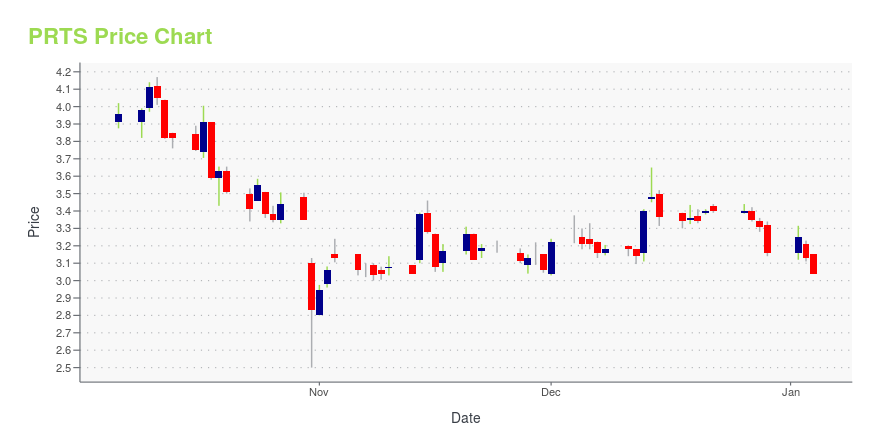
PRTS Stock Price Chart Interactive Chart >
PRTS POWR Grades
- PRTS scores best on the Quality dimension, with a Quality rank ahead of 84.03% of US stocks.
- The strongest trend for PRTS is in Quality, which has been heading up over the past 179 days.
- PRTS's current lowest rank is in the Growth metric (where it is better than 11.44% of US stocks).
PRTS Stock Summary
- The capital turnover (annual revenue relative to shareholder's equity) for PRTS is 5.66 -- better than 92.27% of US stocks.
- Price to trailing twelve month operating cash flow for PRTS is currently 2.95, higher than just 10.76% of US stocks with positive operating cash flow.
- Over the past twelve months, PRTS has reported earnings growth of 125.5%, putting it ahead of 89.94% of US stocks in our set.
- Stocks that are quantitatively similar to PRTS, based on their financial statements, market capitalization, and price volatility, are APAM, VVOS, HURC, MPX, and EDBL.
- Visit PRTS's SEC page to see the company's official filings. To visit the company's web site, go to www.usautoparts.net.
PRTS Valuation Summary
- PRTS's EV/EBIT ratio is -45.7; this is 422.97% lower than that of the median Consumer Cyclical stock.
- Over the past 202 months, PRTS's EV/EBIT ratio has gone down 114.1.
Below are key valuation metrics over time for PRTS.
Stock | Date | P/S | P/B | P/E | EV/EBIT |
---|---|---|---|---|---|
PRTS | 2023-09-13 | 0.4 | 2.0 | -35.5 | -45.7 |
PRTS | 2023-09-12 | 0.4 | 2.0 | -35.4 | -45.5 |
PRTS | 2023-09-11 | 0.4 | 2.1 | -36.4 | -46.9 |
PRTS | 2023-09-08 | 0.4 | 2.2 | -37.8 | -49.1 |
PRTS | 2023-09-07 | 0.4 | 2.2 | -38.5 | -50.3 |
PRTS | 2023-09-06 | 0.4 | 2.2 | -39.1 | -51.2 |
PRTS Growth Metrics
- Its 4 year price growth rate is now at 20.58%.
- The 2 year cash and equivalents growth rate now stands at 76.95%.
- Its 3 year net income to common stockholders growth rate is now at 40.1%.

The table below shows PRTS's growth in key financial areas (numbers in millions of US dollars).
Date | Revenue | Operating Cash Flow | Net Income to Common Stock |
---|---|---|---|
2022-09-30 | 645.336 | 7.063 | 0.243 |
2022-06-30 | 622.375 | -2.51 | -3.468 |
2022-03-31 | 603.691 | -14.773 | -5.514 |
2021-12-31 | 582.44 | -6.988 | -10.339 |
2021-09-30 | 563.914 | -29.027 | -8.797 |
2021-06-30 | 539.474 | -43.255 | -2.753 |
PRTS's Quality Factors
The “Quality” component of the POWR Ratings focuses on 31 different factors of a companies fundamentals and operational strength. Here are some key insights as we drill into the specifics of these quality attributes.- PRTS has a Quality Grade of D, ranking ahead of 22.27% of graded US stocks.
- PRTS's asset turnover comes in at 2.71 -- ranking 18th of 165 Retail stocks.
- FLWS, BOOT, and GRWG are the stocks whose asset turnover ratios are most correlated with PRTS.
The table below shows PRTS's key quality metrics over time.
Period | Asset Turnover | Gross Margin | ROIC |
---|---|---|---|
2021-10-02 | 2.710 | 0.340 | -0.062 |
2021-07-03 | 2.686 | 0.347 | -0.013 |
2021-04-03 | 2.748 | 0.349 | -0.019 |
2021-01-02 | 2.821 | 0.350 | 0.007 |
2020-09-26 | 2.920 | 0.349 | 0.029 |
2020-06-27 | 3.061 | 0.333 | -0.036 |
PRTS Price Target
For more insight on analysts targets of PRTS, see our PRTS price target page. And for a list of of all stocks sorted by upside potential based on analyst target price, see our Top Price Target page.
Average Price Target | $26.00 | Average Broker Recommendation | 1.5 (Moderate Buy) |
CarParts.com Inc. (PRTS) Company Bio
CarParts.com, Inc. operates as an online provider of aftermarket auto parts and accessories in the United States and the Philippines. Its products include Collision Parts, Engine Parts, Performance Parts and Accessories. The firm also sells auto parts to collision repair shops, markets Kool-Vue products to auto parts wholesale distributor, and aftermarket catalytic converters under the Evan Fischer brand. Its flagship Websites include www.carparts.com, www.jcwhitney.com, www.autopartswarehouse.com and www.usautoparts.com. The company was founded by Sol Khazani and Mehran Nia in 1995 and is headquartered in Carson, CA.
Latest PRTS News From Around the Web
Below are the latest news stories about CARPARTSCOM INC that investors may wish to consider to help them evaluate PRTS as an investment opportunity.
Gabelli Funds to Host 47th Annual Automotive Symposium at The Encore at Wynn, Las Vegas, NevadaRYE, N.Y., Sept. 11, 2023 (GLOBE NEWSWIRE) -- Gabelli Funds will host the 47th Annual Automotive Symposium on October 30th and 31st, 2023 at the Encore at Wynn in Las Vegas, Nevada. This two-day symposium will feature presentations by senior managements of leading automotive and trucking companies, with a lineup that enables investors to understand ever-changing dynamics within the automotive industry. Presenting attendees, which include original equipment suppliers, automotive retailers, afterm |
High-Stakes Picks: 7 Speculative Stocks for the Bold InvestorWhile speculative stock picks present extraordinary risks, these compelling ideas also enjoy the backing of Wall Street’s finest. |
Insiders Are Betting Big on These 3 Stocks Under $10If you’re going to dive into the world of low-priced securities, these stocks with insider buying may provide a confidence boost. |
7 Stocks to Buy Now to Beat the Inflation BluesWith the Federal Reserve still struggling mightily against elevated consumer prices, these are the stocks to beat inflation. |
CarParts.com Reports Highest Quarterly Sales in Company HistoryCarParts.com, Inc. (NASDAQ: PRTS), one of the leading eCommerce providers of automotive parts and accessories, and a one-stop shop for vehicle repair and maintenance needs, is reporting results for the second quarter ended July 1, 2023. |
PRTS Price Returns
1-mo | -9.66% |
3-mo | -1.23% |
6-mo | -20.24% |
1-year | -25.69% |
3-year | -64.27% |
5-year | 148.15% |
YTD | -35.78% |
2022 | -44.11% |
2021 | -9.60% |
2020 | 463.18% |
2019 | 141.76% |
2018 | -63.89% |
Continue Researching PRTS
Want to see what other sources are saying about US Auto Parts Network Inc's financials and stock price? Try the links below:US Auto Parts Network Inc (PRTS) Stock Price | Nasdaq
US Auto Parts Network Inc (PRTS) Stock Quote, History and News - Yahoo Finance
US Auto Parts Network Inc (PRTS) Stock Price and Basic Information | MarketWatch
Loading social stream, please wait...