
Prudential Financial Inc. (PRU): Price and Financial Metrics
PRU Price/Volume Stats
| Current price | $124.14 | 52-week high | $128.52 |
| Prev. close | $123.09 | 52-week low | $87.95 |
| Day low | $123.44 | Volume | 1,315,900 |
| Day high | $124.98 | Avg. volume | 1,448,308 |
| 50-day MA | $119.35 | Dividend yield | 4.18% |
| 200-day MA | $108.27 | Market Cap | 44.57B |
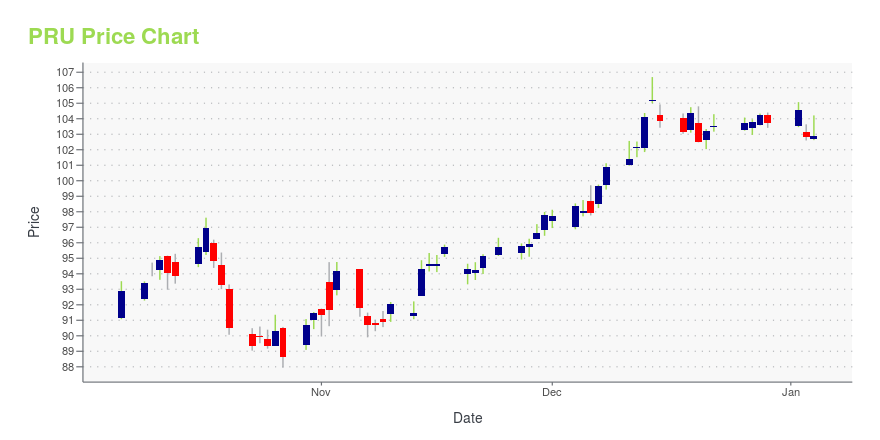
PRU Stock Price Chart Interactive Chart >
Prudential Financial Inc. (PRU) Company Bio
Prudential Financial, Inc. is an American Fortune Global 500 and Fortune 500 company whose subsidiaries provide insurance, investment management, and other financial products and services to both retail and institutional customers throughout the United States and in over 40 other countries. (Source:Wikipedia)
Latest PRU News From Around the Web
Below are the latest news stories about PRUDENTIAL FINANCIAL INC that investors may wish to consider to help them evaluate PRU as an investment opportunity.
3 Bargain Stocks You Can Buy Today and Hold ForeverWhen the market offers you a value price on a solid business, it's often a good idea to take it up on that offer. |
15 Best Long Term Care Insurance Companies Heading into 2024In this article, we will look into the 15 best long-term care insurance companies heading into 2024. If you want to skip our detailed analysis, you can go directly to the 5 Best Long Term Care Insurance Companies Heading into 2024. Market Analysis of Long-Term Care Insurance Long-term care insurance is provided to senior citizens […] |
Dividend Contenders List Ranked By Yield: Top 25In this article, we discuss top 25 dividend contenders according to yields. You can skip our detailed analysis of dividend stocks and their previous performance, and go directly to read Dividend Contenders List Ranked By Yield: Top 10. Dividend contenders typically refer to companies that have consistently increased their dividends for at least 10 consecutive […] |
Jim Cramer Stock Portfolio: 12 Recent AdditionsIn this article, we discuss the 12 recent additions to the Jim Cramer stock portfolio. If you want to read about some more Cramer stocks, go directly to Jim Cramer Stock Portfolio: 5 Recent Additions. Jim Cramer, the host of Mad Money on CNBC, is one of the most well-known finance personalities on television. He […] |
Jim Cramer Says Recession Is Not Coming and Recommends These 11 StocksIn this article, we will take a detailed look at the Jim Cramer Says Recession Is Not Coming and Recommends These 11 Stocks. For a quick overview of such stocks, read our article Jim Cramer Says Recession Is Not Coming and Recommends These 5 Stocks. On December 14, an enthusiastic Jim Cramer announced on his program on CNBC that the […] |
PRU Price Returns
| 1-mo | 5.54% |
| 3-mo | 13.56% |
| 6-mo | 19.56% |
| 1-year | 35.33% |
| 3-year | 42.63% |
| 5-year | 54.97% |
| YTD | 22.45% |
| 2023 | 10.09% |
| 2022 | -3.86% |
| 2021 | 45.32% |
| 2020 | -11.40% |
| 2019 | 20.10% |
PRU Dividends
| Ex-Dividend Date | Type | Payout Amount | Change | ||||||
|---|---|---|---|---|---|---|---|---|---|
| Loading, please wait... | |||||||||
Continue Researching PRU
Want to see what other sources are saying about Prudential Financial Inc's financials and stock price? Try the links below:Prudential Financial Inc (PRU) Stock Price | Nasdaq
Prudential Financial Inc (PRU) Stock Quote, History and News - Yahoo Finance
Prudential Financial Inc (PRU) Stock Price and Basic Information | MarketWatch
Loading social stream, please wait...