Public Storage (PSA): Price and Financial Metrics
GET POWR RATINGS... FREE!
PSA POWR Grades
- PSA scores best on the Sentiment dimension, with a Sentiment rank ahead of 96.28% of US stocks.
- The strongest trend for PSA is in Momentum, which has been heading up over the past 179 days.
- PSA ranks lowest in Value; there it ranks in the 14th percentile.
PSA Stock Summary
- PSA has a market capitalization of $69,565,517,465 -- more than approximately 96.15% of US stocks.
- Of note is the ratio of Public Storage's sales and general administrative expense to its total operating expenses; merely 4.75% of US stocks have a lower such ratio.
- With a year-over-year growth in debt of 193.72%, Public Storage's debt growth rate surpasses 94.31% of about US stocks.
- Stocks with similar financial metrics, market capitalization, and price volatility to Public Storage are CNQ, HLT, ARE, DLR, and PXD.
- PSA's SEC filings can be seen here. And to visit Public Storage's official web site, go to www.publicstorage.com.
PSA Valuation Summary
- In comparison to the median Real Estate stock, PSA's price/earnings ratio is 21.44% higher, now standing at 45.6.
- Over the past 243 months, PSA's price/sales ratio has gone up 13.9.
- PSA's EV/EBIT ratio has moved up 26.4 over the prior 243 months.
Below are key valuation metrics over time for PSA.
Stock | Date | P/S | P/B | P/E | EV/EBIT |
---|---|---|---|---|---|
PSA | 2021-09-02 | 18.8 | 6.6 | 45.6 | 39.4 |
PSA | 2021-09-01 | 18.7 | 6.6 | 45.4 | 39.3 |
PSA | 2021-08-31 | 18.4 | 6.5 | 44.6 | 38.6 |
PSA | 2021-08-30 | 18.2 | 6.4 | 44.2 | 38.3 |
PSA | 2021-08-27 | 18.0 | 6.4 | 43.8 | 38.0 |
PSA | 2021-08-26 | 18.0 | 6.3 | 43.6 | 37.8 |
PSA Growth Metrics
- Its 2 year cash and equivalents growth rate is now at 97.9%.
- Its 5 year cash and equivalents growth rate is now at 135.01%.
- Its 3 year revenue growth rate is now at 14.01%.

The table below shows PSA's growth in key financial areas (numbers in millions of US dollars).
Date | Revenue | Operating Cash Flow | Net Income to Common Stock |
---|---|---|---|
2021-12-31 | 3,415.824 | 2,543.555 | 1,732.444 |
2021-09-30 | 3,250.552 | 2,327.282 | 1,466.552 |
2021-06-30 | 3,086.278 | 2,171.283 | 1,271.141 |
2021-03-31 | 2,966.248 | 2,089.114 | 1,171.011 |
2020-12-31 | 2,915.068 | 2,042.902 | 1,098.335 |
2020-09-30 | 2,873.523 | 2,030.329 | 1,133.42 |
PSA's Quality Factors
The “Quality” component of the POWR Ratings focuses on 31 different factors of a companies fundamentals and operational strength. Here are some key insights as we drill into the specifics of these quality attributes.- PSA has a Quality Grade of C, ranking ahead of 72.65% of graded US stocks.
- PSA's asset turnover comes in at 0.243 -- ranking 81st of 444 Trading stocks.
- SACH, CTT, and NXRT are the stocks whose asset turnover ratios are most correlated with PSA.
The table below shows PSA's key quality metrics over time.
Period | Asset Turnover | Gross Margin | ROIC |
---|---|---|---|
2021-09-30 | 0.243 | 0.726 | 0.105 |
2021-06-30 | 0.249 | 0.718 | 0.105 |
2021-03-31 | 0.250 | 0.704 | 0.107 |
2020-12-31 | 0.246 | 0.702 | 0.105 |
2020-09-30 | 0.245 | 0.710 | 0.110 |
2020-06-30 | 0.245 | 0.711 | 0.117 |
PSA Price Target
For more insight on analysts targets of PSA, see our PSA price target page. And for a list of of all stocks sorted by upside potential based on analyst target price, see our Top Price Target page.
Average Price Target | $333.43 | Average Broker Recommendation | 1.81 (Hold) |
PSA Stock Price Chart Interactive Chart >
PSA Price/Volume Stats
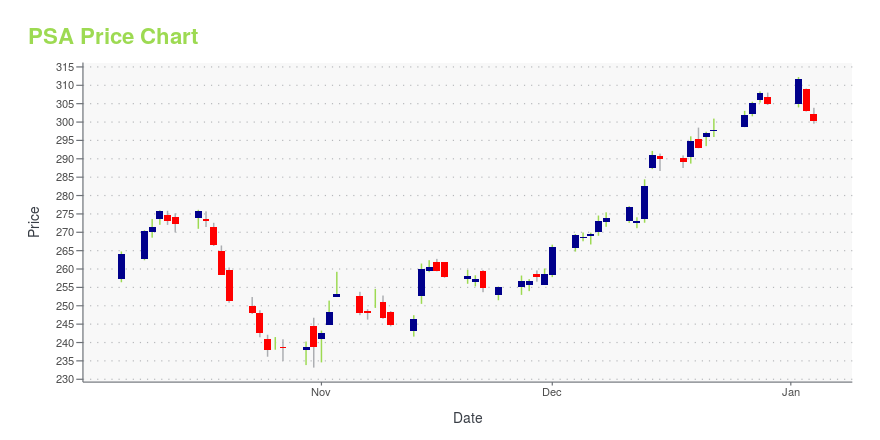
Current price | $325.99 | 52-week high | $421.76 |
Prev. close | $320.10 | 52-week low | $276.15 |
Day low | $318.00 | Volume | 1,069,843 |
Day high | $327.20 | Avg. volume | 757,402 |
50-day MA | $369.11 | Dividend yield | 2.5% |
200-day MA | $345.89 | Market Cap | 57.20B |
Public Storage (PSA) Company Bio
Public Storage is an American international self storage company headquartered in Glendale, California, that is run as a real estate investment trust (REIT). It is the largest brand of self-storage services in the US.[4] In 2008, it was the largest of four publicly traded storage REITs.[5] There are more than 2,200 Public Storage self-storage locations in the US, Canada and Europe. It also owns 42 percent of an office parks subsidiary, sells packing supplies, and provides other services. As a REIT, it is owned by real estate investors, who receive more than 90 percent of the company's profits as a return-on-investment. (Source:Wikipedia)
Latest PSA News From Around the Web
Below are the latest news stories about Public Storage that investors may wish to consider to help them evaluate PSA as an investment opportunity.
Public Storage declares $2.00 dividendPublic Storage (NYSE:PSA) declares $2.00/share quarterly dividend, in line with previous. Forward yield 2.22% Payable March 31; for shareholders of record March 16; ex-div March 15. See PSA Dividend Scorecard, Yield Chart, & Dividend Growth.... |
Public Storage Stock Could Move Uphttps://www.investing.com/analysis/public-storage-stock-could-move-up-200618578 |
10 Stocks Making Moves After Earnings ReportsIn this article, we will take a look at the 10 stocks making moves after earnings reports. You can skip our detailed analysis of these companies and go directly to the 5 Stocks Making Moves After Earnings Reports. Stocks from the consumer cyclical, technology and real estate sectors, including MercadoLibre, Inc. (NASDAQ:MELI), The Home Depot, […] |
Public Storage (PSA) Tops Q4 FFO, Issues Upbeat '22 ViewPublic Storage's (PSA) Q4 results reflect an increase in the realized annual rent per available square foot and weighted average square foot occupancy. The company gains from expansion moves. |
Public Storage 2022 guidance exceeds consensus after Q4 earnings beatPublic Storage (NYSE:PSA) stock jumps 4.3% in after-hours trading after the self-storage REIT issued guidance for 2022 core FFO per share of $14.75-$15.65, topping the average analyst estimate of $14.51. Guidance assumes same-store net operating income (NOI) growth of 13.4%-18.0%, same-store revenue growth of 12%-15%, and $1.0B in acquisitions. Q4 core FFO allocable... |
PSA Price Returns
1-mo | -18.98% |
3-mo | -7.25% |
6-mo | N/A |
1-year | 19.95% |
3-year | 52.03% |
5-year | 78.50% |
YTD | -12.48% |
2021 | 66.63% |
2020 | 12.69% |
2019 | 8.96% |
2018 | 0.62% |
2017 | -2.89% |
PSA Dividends
Ex-Dividend Date | Type | Payout Amount | Change | ||||||
---|---|---|---|---|---|---|---|---|---|
Loading, please wait... |
Continue Researching PSA
Want to see what other sources are saying about Public Storage's financials and stock price? Try the links below:Public Storage (PSA) Stock Price | Nasdaq
Public Storage (PSA) Stock Quote, History and News - Yahoo Finance
Public Storage (PSA) Stock Price and Basic Information | MarketWatch
Loading social stream, please wait...