Paysafe Limited (PSFE): Price and Financial Metrics
PSFE Price/Volume Stats
Current price | $11.94 | 52-week high | $24.25 |
Prev. close | $12.07 | 52-week low | $9.34 |
Day low | $11.71 | Volume | 53,805 |
Day high | $12.10 | Avg. volume | 435,944 |
50-day MA | $12.38 | Dividend yield | N/A |
200-day MA | $14.63 | Market Cap | 725.82M |
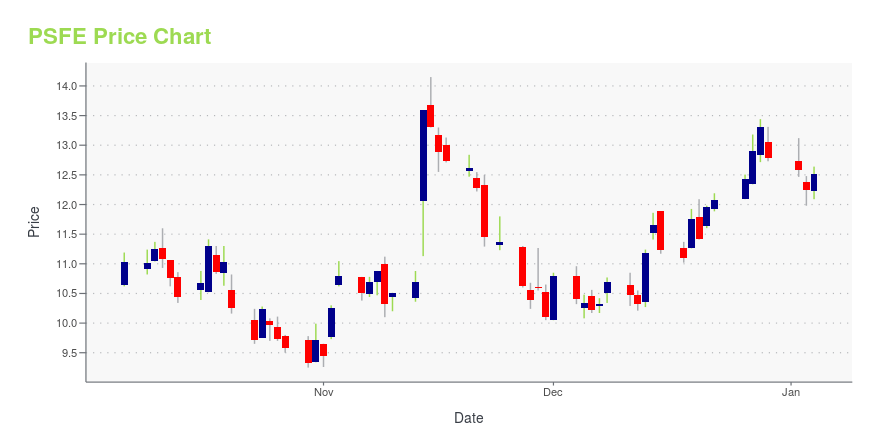
PSFE Stock Price Chart Interactive Chart >
PSFE POWR Grades
- PSFE scores best on the Growth dimension, with a Growth rank ahead of 97.5% of US stocks.
- PSFE's strongest trending metric is Value; it's been moving up over the last 178 days.
- PSFE's current lowest rank is in the Quality metric (where it is better than 15.31% of US stocks).
PSFE Stock Summary
- The price/operating cash flow metric for PAYSAFE LTD is higher than only 8.1% of stocks in our set with a positive cash flow.
- The volatility of PAYSAFE LTD's share price is greater than that of 92.13% US stocks with at least 200 days of trading history.
- Shareholder yield, a measure of how much is returned to shareholders via dividends and share repurchases, for PSFE comes in at 13.53% -- higher than that of 88.47% of stocks in our set.
- Stocks with similar financial metrics, market capitalization, and price volatility to PAYSAFE LTD are DXC, ML, VRRM, BFI, and SXC.
- To check out PAYSAFE LTD's SEC filings, go to the company's page on browse-edgar?action=getcompany&CIK=0001833835.
PSFE Valuation Summary
- PSFE's price/sales ratio is 0.5; this is 83.33% lower than that of the median Technology stock.
- Over the past 36 months, PSFE's price/sales ratio has gone down 0.6.
Below are key valuation metrics over time for PSFE.
Stock | Date | P/S | P/B | P/E | EV/EBIT |
---|---|---|---|---|---|
PSFE | 2023-07-31 | 0.5 | 0.8 | -1.1 | -5.6 |
PSFE | 2023-07-28 | 0.5 | 0.8 | -1.0 | -5.6 |
PSFE | 2023-07-27 | 0.5 | 0.8 | -1.0 | -5.5 |
PSFE | 2023-07-26 | 0.5 | 0.8 | -1.0 | -5.6 |
PSFE | 2023-07-25 | 0.5 | 0.8 | -1.0 | -5.6 |
PSFE | 2023-07-24 | 0.5 | 0.8 | -1.0 | -5.6 |
PSFE's Quality Factors
The “Quality” component of the POWR Ratings focuses on 31 different factors of a companies fundamentals and operational strength. Here are some key insights as we drill into the specifics of these quality attributes.- PSFE has a Quality Grade of C, ranking ahead of 31.54% of graded US stocks.
- PSFE's asset turnover comes in at 0.435 -- ranking 53rd of 444 Trading stocks.
- 500 - Internal server error
The table below shows PSFE's key quality metrics over time.
Period | Asset Turnover | Gross Margin | ROIC |
---|---|---|---|
2021-06-30 | 0.435 | 0.61 | 0.055 |
Paysafe Limited (PSFE) Company Bio
Paysafe Group HPaysafe Groupoldings Limited offers payment processing, payment gateway, payment wallet, and related merchant services. Paysafe Group Holdings Limited was formerly known as PI UK Holdco I Ltd and changed its name to Paysafe Group Holdings Limited in May 2018. The company was incorporated 2017 and is based in London, United Kingdom. Paysafe Group Holdings Limited operates as a subsidiary of Pi Jersey Topco Limited (Topco).
Latest PSFE News From Around the Web
Below are the latest news stories about PAYSAFE LTD that investors may wish to consider to help them evaluate PSFE as an investment opportunity.
PSFE vs. DLO: Which Stock Is the Better Value Option?PSFE vs. DLO: Which Stock Is the Better Value Option? |
Global Payments (GPN) Jumps 20% in 6 Months: More Growth Ahead?Global Payments (GPN) is poised for long-term growth due to the rising demand for digital payment methods amid the growing digitalization of economies worldwide. |
Mastercard (MA), AEGF to Digitize India's Agriculture SpaceMastercard (MA) teams up with AEGF to combine their expertise and networks to provide India farmers expanded access to agricultural marketplaces and formal financial services. |
Paysafe Limited (PSFE) Stock Moves -0.78%: What You Should KnowPaysafe Limited (PSFE) closed at $12.73 in the latest trading session, marking a -0.78% move from the prior day. |
Mastercard (MA) SpendingPulse Expects a Rise in Holiday SpendingMastercard (MA) expects that the growing use of digital workspaces and consumers upgrading their gadgets will drive this holiday season's electronic sales growth. |
PSFE Price Returns
1-mo | -7.08% |
3-mo | 18.33% |
6-mo | -30.86% |
1-year | -31.38% |
3-year | N/A |
5-year | N/A |
YTD | -14.04% |
2022 | -70.40% |
2021 | -74.11% |
2020 | N/A |
2019 | N/A |
2018 | N/A |
Loading social stream, please wait...