
Pearson, Plc (PSO): Price and Financial Metrics
PSO Price/Volume Stats
| Current price | $13.44 | 52-week high | $13.50 |
| Prev. close | $13.31 | 52-week low | $10.27 |
| Day low | $13.38 | Volume | 534,400 |
| Day high | $13.50 | Avg. volume | 381,337 |
| 50-day MA | $12.45 | Dividend yield | 2.98% |
| 200-day MA | $12.25 | Market Cap | 9.00B |
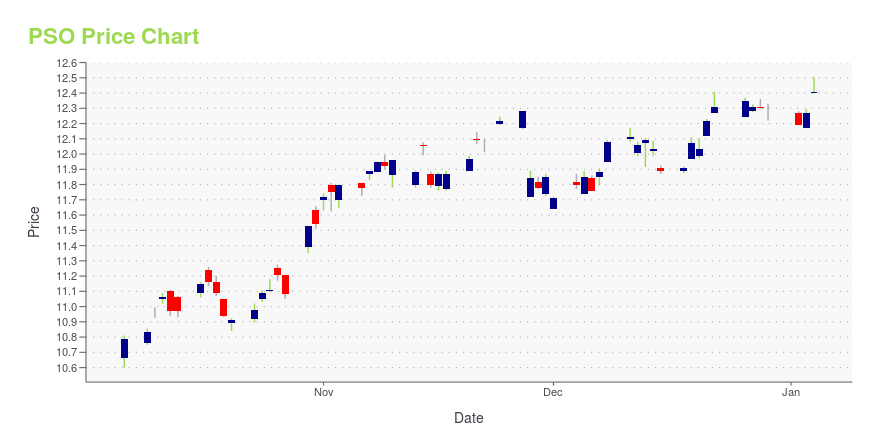
PSO Stock Price Chart Interactive Chart >
Pearson, Plc (PSO) Company Bio
Pearson plc provides learning materials, technologies, assessments, and services for teachers and students worldwide. The company is also a global leader in computer-based testing for high-stakes certification and licensure exams in the healthcare, finance, information technology, academic and admissions markets. The company was founded in 1844 and is based in London, United Kingdom.
Latest PSO News From Around the Web
Below are the latest news stories about PEARSON PLC that investors may wish to consider to help them evaluate PSO as an investment opportunity.
25 Best Online Degree Programs For Working AdultsIn this article, we will be looking at the 25 best online degree programs for working adults. If you want to skip our detailed analysis, you can go directly to the 5 Best Online Degree Programs For Working Adults. The Ed Tech Boom Driving Adult Online Learning The adoption of EdTech was accelerated across the […] |
The UK IPO Market Hasn’t Been This Slow Since the Great Financial Crisis(Bloomberg) -- For London, 2023 has been a year to forget for initial public offerings.Most Read from BloombergApple to Halt US Sales of Smartwatches After Patent LossUS Frackers Return to Haunt OPEC’s Pricing StrategyGulf Splits Hinder US Efforts to End Houthi Ship AttacksBP to Pause All Tanker Transits Through the Red SeaDocuments Reveal Hidden Problems at Russia’s Nuclear PowerhouseUK stock listings this year have barely reached $1 billion, just a fraction of normal levels and on track to sur |
Pearson to Expand Generative AI to Millions of US College StudentsAs students wrap up the fall semester, Pearson (FTSE: PSON.L) today announced plans to expand the availability of its generative AI beta to millions of students in leading math, science and business titles. This summer, Pearson became the first major higher education publisher to integrate generative AI study tools into its proprietary academic content. |
How Gen AI Proof is Your job?New workplace research from Pearson (FTSE: PSON.L), the world's leading learning company, finds that white collar roles are under greater threat from generative AI than blue collar roles, as the technology takes a greater foothold in the global economy. |
Pearson Teams Up with Forage to Offer Virtual Job Simulations to Millions of College Students Through Leading Higher Ed ProductsPearson (FTSE: PSON.L), the world's leading learning company and Forage, a platform dedicated to helping students get jobs at the world's top employers, today announced a partnership to embed job simulations into Pearson's MyLab courseware platform and in Pearson+. |
PSO Price Returns
| 1-mo | 8.30% |
| 3-mo | 8.56% |
| 6-mo | 11.77% |
| 1-year | 23.83% |
| 3-year | 22.87% |
| 5-year | 36.90% |
| YTD | 11.05% |
| 2023 | 12.03% |
| 2022 | 37.43% |
| 2021 | -6.13% |
| 2020 | 13.07% |
| 2019 | -27.76% |
PSO Dividends
| Ex-Dividend Date | Type | Payout Amount | Change | ||||||
|---|---|---|---|---|---|---|---|---|---|
| Loading, please wait... | |||||||||
Continue Researching PSO
Want to see what other sources are saying about Pearson Plc's financials and stock price? Try the links below:Pearson Plc (PSO) Stock Price | Nasdaq
Pearson Plc (PSO) Stock Quote, History and News - Yahoo Finance
Pearson Plc (PSO) Stock Price and Basic Information | MarketWatch
Loading social stream, please wait...