PTC Inc. (PTC): Price and Financial Metrics
GET POWR RATINGS... FREE!
PTC POWR Grades
- Quality is the dimension where PTC ranks best; there it ranks ahead of 89.31% of US stocks.
- The strongest trend for PTC is in Quality, which has been heading up over the past 177 days.
- PTC ranks lowest in Momentum; there it ranks in the 28th percentile.
PTC Stock Summary
- PTC has a market capitalization of $14,392,631,805 -- more than approximately 87.41% of US stocks.
- PTC's one year PEG ratio, measuring expected growth in earnings next year relative to current common stock price is 276.74 -- higher than 89.48% of US-listed equities with positive expected earnings growth.
- PTC INC's stock had its IPO on March 26, 1990, making it an older stock than 86.24% of US equities in our set.
- If you're looking for stocks that are quantitatively similar to PTC INC, a group of peers worth examining would be NTRA, APP, NTNX, ANSS, and YELP.
- Visit PTC's SEC page to see the company's official filings. To visit the company's web site, go to www.ptc.com.
PTC Valuation Summary
- In comparison to the median Technology stock, PTC's price/sales ratio is 192% higher, now standing at 7.3.
- PTC's EV/EBIT ratio has moved up 37.1 over the prior 243 months.
Below are key valuation metrics over time for PTC.
Stock | Date | P/S | P/B | P/E | EV/EBIT |
---|---|---|---|---|---|
PTC | 2023-03-21 | 7.3 | 5.9 | 41.6 | 31.7 |
PTC | 2023-03-20 | 7.3 | 5.9 | 41.2 | 31.4 |
PTC | 2023-03-17 | 7.2 | 5.8 | 41.0 | 31.3 |
PTC | 2023-03-16 | 7.3 | 5.9 | 41.3 | 31.5 |
PTC | 2023-03-15 | 7.2 | 5.8 | 40.6 | 31.0 |
PTC | 2023-03-14 | 7.3 | 5.9 | 41.5 | 31.6 |
PTC Growth Metrics
- Its year over year revenue growth rate is now at 15.04%.
- The 2 year net income to common stockholders growth rate now stands at 1173.69%.
- Its year over year net cashflow from operations growth rate is now at 10.56%.

The table below shows PTC's growth in key financial areas (numbers in millions of US dollars).
Date | Revenue | Operating Cash Flow | Net Income to Common Stock |
---|---|---|---|
2022-12-31 | 1,941.536 | 478.511 | 342.027 |
2022-09-30 | 1,933.347 | 435.326 | 313.081 |
2022-06-30 | 1,906.077 | 442.148 | 499.187 |
2022-03-31 | 1,879.271 | 413.416 | 479.914 |
2021-12-31 | 1,835.829 | 392.783 | 499.497 |
2021-09-30 | 1,807.159 | 368.809 | 476.923 |
PTC's Quality Factors
The “Quality” component of the POWR Ratings focuses on 31 different factors of a companies fundamentals and operational strength. Here are some key insights as we drill into the specifics of these quality attributes.- PTC has a Quality Grade of B, ranking ahead of 87.2% of graded US stocks.
- PTC's asset turnover comes in at 0.451 -- ranking 343rd of 561 Business Services stocks.
- CBZ, VERI, and CTEK are the stocks whose asset turnover ratios are most correlated with PTC.
The table below shows PTC's key quality metrics over time.
Period | Asset Turnover | Gross Margin | ROIC |
---|---|---|---|
2021-06-30 | 0.451 | 0.793 | 0.167 |
2021-03-31 | 0.454 | 0.792 | 0.171 |
2020-12-31 | 0.435 | 0.782 | 0.151 |
2020-09-30 | 0.420 | 0.771 | 0.115 |
2020-06-27 | 0.425 | 0.761 | 0.114 |
2020-03-28 | 0.432 | 0.749 | 0.092 |
PTC Price Target
For more insight on analysts targets of PTC, see our PTC price target page. And for a list of of all stocks sorted by upside potential based on analyst target price, see our Top Price Target page.
Average Price Target | $163.31 | Average Broker Recommendation | 1.46 (Moderate Buy) |
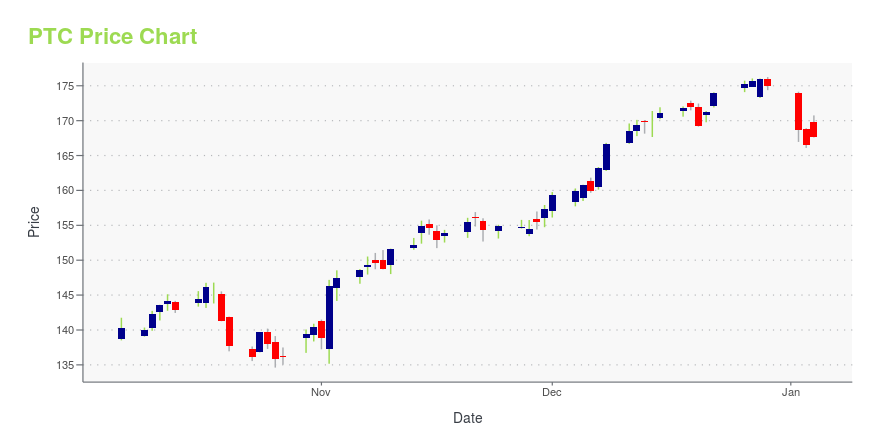
PTC Stock Price Chart Interactive Chart >
PTC Price/Volume Stats
Current price | $126.01 | 52-week high | $139.91 |
Prev. close | $124.71 | 52-week low | $96.55 |
Day low | $125.32 | Volume | 85,039 |
Day high | $126.63 | Avg. volume | 716,664 |
50-day MA | $127.42 | Dividend yield | N/A |
200-day MA | $119.33 | Market Cap | 14.90B |
PTC Inc. (PTC) Company Bio
PTC Inc. (formerly Parametric Technology Corporation) is an American computer software and services company founded in 1985 and headquartered in Boston, Massachusetts. The global technology company has over 6,000 employees across 80 offices in 30 countries, 1,150 technology partners and over $1bn in revenue. The company began developing parametric, associative feature-based, solid computer-aided design (CAD) modeling software in 1988, including an Internet-based product for product lifecycle management (PLM) in 1998. (Source:Wikipedia)
Latest PTC News From Around the Web
Below are the latest news stories about PTC INC that investors may wish to consider to help them evaluate PTC as an investment opportunity.
At US$122, Is PTC Inc. (NASDAQ:PTC) Worth Looking At Closely?Today we're going to take a look at the well-established PTC Inc. ( NASDAQ:PTC ). The company's stock received a lot of... |
15 Best Augmented Reality Stocks to Buy NowIn this piece, we will take a look at the 15 best augmented reality stocks to buy now. For more stocks, head on over to 5 Best Augmented Reality Stocks to Buy Now. Augmented reality is set to revolutionize the ways we interact with our surroundings. Most folks often confuse augmented reality with virtual reality, […] |
13 Best Automation Stocks To Buy NowIn this piece, we will take a look at the 13 best automation stocks to buy now. For more stocks, head on over to 5 Best Automation Stocks to Buy Now. From the palm of your hand, to your refrigerator, and your car, technology is everywhere. Alongside disrupting consumers’ lives, tech has also transformed industries […] |
Why These 2 Growth Stocks Are Screaming Buys Right NowInvestors are underestimating the amount of cash both these companies will generate in the coming years. |
30 Biggest SaaS Companies in the World in 2023In this piece, we will take a look at the 30 biggest SaaS companies in the world. For more companies, head on over to 10 Biggest SaaS Companies in the World. The software as a service (SaaS) industry is one of the hottest sectors in the technology sector right now. The growth of the Internet […] |
PTC Price Returns
1-mo | 0.54% |
3-mo | 4.97% |
6-mo | 20.47% |
1-year | 15.40% |
3-year | 112.60% |
5-year | 61.53% |
YTD | 4.97% |
2022 | -0.92% |
2021 | 1.29% |
2020 | 59.71% |
2019 | -9.66% |
2018 | 36.42% |
Continue Researching PTC
Want to do more research on Ptc Inc's stock and its price? Try the links below:Ptc Inc (PTC) Stock Price | Nasdaq
Ptc Inc (PTC) Stock Quote, History and News - Yahoo Finance
Ptc Inc (PTC) Stock Price and Basic Information | MarketWatch
Loading social stream, please wait...