Peloton Interactive Inc. (PTON): Price and Financial Metrics
GET POWR RATINGS... FREE!
PTON POWR Grades
- PTON scores best on the Momentum dimension, with a Momentum rank ahead of 32.81% of US stocks.
- The strongest trend for PTON is in Quality, which has been heading down over the past 179 days.
- PTON's current lowest rank is in the Stability metric (where it is better than 1.01% of US stocks).
PTON Stock Summary
- PTON's one year PEG ratio, measuring expected growth in earnings next year relative to current common stock price is 1.19 -- higher than just 5.69% of US-listed equities with positive expected earnings growth.
- In terms of twelve month growth in earnings before interest and taxes, Peloton Interactive Inc is reporting a growth rate of -757.84%; that's higher than merely 2.86% of US stocks.
- In terms of volatility of its share price, PTON is more volatile than 98.16% of stocks we're observing.
- Stocks with similar financial metrics, market capitalization, and price volatility to Peloton Interactive Inc are AWH, EKSO, TAOP, INSP, and VCYT.
- Visit PTON's SEC page to see the company's official filings. To visit the company's web site, go to www.onepeloton.com.
PTON Valuation Summary
- In comparison to the median Consumer Cyclical stock, PTON's price/earnings ratio is 651.55% higher, now standing at 145.8.
- PTON's EV/EBIT ratio has moved up 172.9 over the prior 23 months.
- Over the past 23 months, PTON's price/earnings ratio has gone up 175.1.
Below are key valuation metrics over time for PTON.
Stock | Date | P/S | P/B | P/E | EV/EBIT |
---|---|---|---|---|---|
PTON | 2021-08-27 | 8.4 | 15.6 | 145.8 | 144.5 |
PTON | 2021-08-26 | 9.2 | 17.1 | 159.5 | 158.2 |
PTON | 2021-08-25 | 9.4 | 17.4 | 162.5 | 161.3 |
PTON | 2021-08-24 | 9.2 | 17.0 | 158.9 | 157.7 |
PTON | 2021-08-23 | 8.6 | 16.0 | 149.0 | 147.6 |
PTON | 2021-08-20 | 8.7 | 16.2 | 151.1 | 149.7 |
PTON's Quality Factors
The “Quality” component of the POWR Ratings focuses on 31 different factors of a companies fundamentals and operational strength. Here are some key insights as we drill into the specifics of these quality attributes.- PTON has a Quality Grade of D, ranking ahead of 9.09% of graded US stocks.
- PTON's asset turnover comes in at 0.97 -- ranking 11th of 53 Electrical Equipment stocks.
- 500 - Internal server error
The table below shows PTON's key quality metrics over time.
Period | Asset Turnover | Gross Margin | ROIC |
---|---|---|---|
2021-06-30 | 0.970 | 0.361 | -0.080 |
2021-03-31 | 0.979 | 0.403 | 0.110 |
2020-12-31 | 0.913 | 0.436 | 0.097 |
2020-09-30 | 0.811 | 0.450 | 0.029 |
2020-06-30 | 0.694 | 0.458 | -0.041 |
PTON Price Target
For more insight on analysts targets of PTON, see our PTON price target page. And for a list of of all stocks sorted by upside potential based on analyst target price, see our Top Price Target page.
Average Price Target | $129.67 | Average Broker Recommendation | 1.53 (Moderate Buy) |
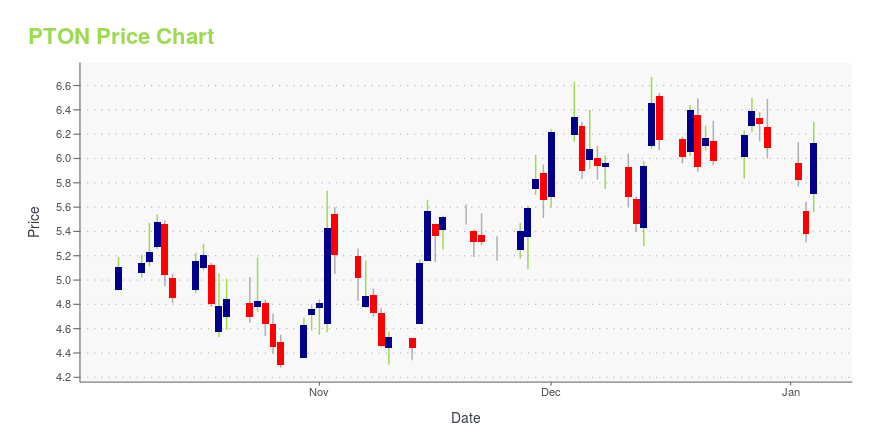
PTON Stock Price Chart Interactive Chart >
PTON Price/Volume Stats
Current price | $12.52 | 52-week high | $129.70 |
Prev. close | $13.62 | 52-week low | $11.25 |
Day low | $12.34 | Volume | 10,298,300 |
Day high | $13.47 | Avg. volume | 20,669,389 |
50-day MA | $21.28 | Dividend yield | N/A |
200-day MA | $51.19 | Market Cap | 4.15B |
Peloton Interactive Inc. (PTON) Company Bio
Peloton Interactive, Inc. is the interactive fitness platform, which engages in the operation of in-studio fitness classes, fitness clubs, at-home fitness equipment & content and health & wellness apps. It operates through the following segments: Connected Fitness Products, Subscription, and Other. The Connected Fitness Products segment engages in the sale of bike and tread and related accessories, associated fees for delivery and installation, and extended warranty agreements. The Subscription segment engages in the connected fitness subscription and digital subscription. The Other segment consists of peloton branded apparel.
Latest PTON News From Around the Web
Below are the latest news stories about Peloton Interactive Inc that investors may wish to consider to help them evaluate PTON as an investment opportunity.
My 5 Surprises This WeekThe ongoing crisis in Eastern Europe is the biggest piece of news this week, but it's not the only thing affecting the markets right now. |
Peloton Interactive Inc. (PTON) Stock Behavior Is Not PredictablePeloton Interactive Inc. (NASDAQ:PTON) at last check was buoying at $27.83 on Friday, February 25, with a fall of -1.66% from its closing price on previous day. Taking a look at stock we notice that its last check on previous day was $28.30 and 5Y monthly beta was reading 0.95 with its price kept floating … Peloton Interactive Inc. (PTON) Stock Behavior Is Not Predictable Read More » |
Peloton never had a moat to protect the business – and that’s why it will be soldMost companies try to accelerate their growth because they want to convert it into a competitive advantage — in other words, a moat. Peloton, which experienced substantial growth at the height of the pandemic and is now going through major changes, including layoffs and a new CEO, never created one. In fact, it’s looking increasingly likely that Peloton (PTON) will be acquired by a firm that will use it to deepen its own moat because the model as a stand-alone seems to have run its course. |
Should You Consider Selling Your Peloton (PTON) Position Before it’s Too Late?Artisan Partners, a high value-added investment management firm, published its ‘Artisan Mid Cap Fund’ fourth quarter 2021 investor letter – a copy of which can be downloaded here. A return of -0.72% was recorded by its Investor Class: ARTMX, -0.68% by its Advisor Class: APDMX, and -0.66% by its Institutional Class: APHMX, in the fourth […] |
Private equity firm L Catterton said to hire banks for possible summer IPOL Catterton, the private equity firm backed by French billionaire and LVMH chief Bernard Arnault, is said to be considering an initial public offer this year that could value the firm at $3B or more. The PE firm recently hired Goldman Sachs and Morgan Stanley to lead an IPO that could happen... |
PTON Price Returns
1-mo | -38.66% |
3-mo | -55.76% |
6-mo | -73.02% |
1-year | -87.41% |
3-year | N/A |
5-year | N/A |
YTD | -64.99% |
2021 | -76.43% |
2020 | 434.23% |
2019 | N/A |
2018 | N/A |
2017 | N/A |
Loading social stream, please wait...