P.A.M. Transportation Services, Inc. (PTSI): Price and Financial Metrics
GET POWR RATINGS... FREE!
PTSI Price/Volume Stats
Current price | $25.66 | 52-week high | $37.44 |
Prev. close | $25.06 | 52-week low | $21.56 |
Day low | $25.45 | Volume | 18,500 |
Day high | $26.18 | Avg. volume | 23,364 |
50-day MA | $25.40 | Dividend yield | N/A |
200-day MA | $28.31 | Market Cap | 565.37M |
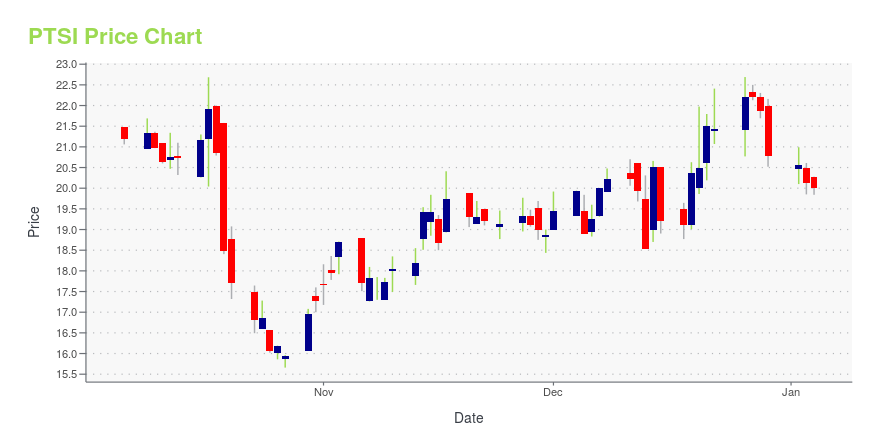
PTSI Stock Price Chart Interactive Chart >
PTSI POWR Grades
- PTSI scores best on the Sentiment dimension, with a Sentiment rank ahead of 93.86% of US stocks.
- The strongest trend for PTSI is in Growth, which has been heading down over the past 179 days.
- PTSI ranks lowest in Growth; there it ranks in the 8th percentile.
PTSI Stock Summary
- The capital turnover (annual revenue relative to shareholder's equity) for PTSI is 3.14 -- better than 83.43% of US stocks.
- PAM TRANSPORTATION SERVICES INC's stock had its IPO on March 26, 1990, making it an older stock than 86.5% of US equities in our set.
- The price/operating cash flow metric for PAM TRANSPORTATION SERVICES INC is higher than just 16.35% of stocks in our set with a positive cash flow.
- Stocks with similar financial metrics, market capitalization, and price volatility to PAM TRANSPORTATION SERVICES INC are AAME, ARKR, SBEV, WERN, and NX.
- PTSI's SEC filings can be seen here. And to visit PAM TRANSPORTATION SERVICES INC's official web site, go to www.pamtransport.com.
PTSI Valuation Summary
- In comparison to the median Industrials stock, PTSI's price/earnings ratio is 59.56% lower, now standing at 7.4.
- Over the past 243 months, PTSI's price/earnings ratio has gone down 8.5.
Below are key valuation metrics over time for PTSI.
Stock | Date | P/S | P/B | P/E | EV/EBIT |
---|---|---|---|---|---|
PTSI | 2023-05-19 | 0.6 | 1.8 | 7.4 | 6.7 |
PTSI | 2023-05-18 | 0.6 | 1.8 | 7.4 | 6.7 |
PTSI | 2023-05-17 | 0.5 | 1.7 | 7.2 | 6.6 |
PTSI | 2023-05-16 | 0.5 | 1.7 | 7.1 | 6.5 |
PTSI | 2023-05-15 | 0.5 | 1.7 | 7.2 | 6.5 |
PTSI | 2023-05-12 | 0.5 | 1.7 | 7.1 | 6.5 |
PTSI Growth Metrics
- The 4 year price growth rate now stands at 117.31%.
- Its 2 year cash and equivalents growth rate is now at 23870.15%.
- The 2 year net income to common stockholders growth rate now stands at 5291.14%.

The table below shows PTSI's growth in key financial areas (numbers in millions of US dollars).
Date | Revenue | Operating Cash Flow | Net Income to Common Stock |
---|---|---|---|
2022-09-30 | 923.16 | 147.857 | 100.581 |
2022-06-30 | 853.615 | 125.3 | 97.374 |
2022-03-31 | 777.71 | 118.907 | 88.509 |
2021-12-31 | 707.12 | 101.74 | 76.516 |
2021-09-30 | 635.956 | 88.44 | 62.578 |
2021-06-30 | 574.813 | 74.936 | 47.219 |
PTSI's Quality Factors
The “Quality” component of the POWR Ratings focuses on 31 different factors of a companies fundamentals and operational strength. Here are some key insights as we drill into the specifics of these quality attributes.- PTSI has a Quality Grade of B, ranking ahead of 81.49% of graded US stocks.
- PTSI's asset turnover comes in at 1.02 -- ranking 33rd of 137 Transportation stocks.
- FWRD, CSX, and NSC are the stocks whose asset turnover ratios are most correlated with PTSI.
The table below shows PTSI's key quality metrics over time.
Period | Asset Turnover | Gross Margin | ROIC |
---|---|---|---|
2021-06-30 | 1.020 | 0.631 | 0.104 |
2021-03-31 | 0.927 | 0.643 | 0.074 |
2020-12-31 | 0.917 | 0.659 | 0.049 |
2020-09-30 | 0.915 | 0.670 | -0.007 |
2020-06-30 | 0.945 | 0.676 | -0.010 |
2020-03-31 | 1.039 | 0.676 | 0.010 |
PTSI Price Target
For more insight on analysts targets of PTSI, see our PTSI price target page. And for a list of of all stocks sorted by upside potential based on analyst target price, see our Top Price Target page.
Average Price Target | $67.00 | Average Broker Recommendation | 1 (Strong Buy) |
P.A.M. Transportation Services, Inc. (PTSI) Company Bio
P.A.M. Transportation Services, Inc., through its subsidiaries, operates as a truckload transportation and logistics company in the United States, Canada, and Mexico. The company is involved in the transportation of general commodities. Its freight primarily consists of automotive parts; expedited goods; and consumer goods, including general retail store merchandise, as well as manufactured goods, such as heating and air conditioning units. The company was founded in 1979 and is based in Tontitown, Arkansas.
Latest PTSI News From Around the Web
Below are the latest news stories about PAM TRANSPORTATION SERVICES INC that investors may wish to consider to help them evaluate PTSI as an investment opportunity.
P.A.M. Transportation Services, Inc.'s (NASDAQ:PTSI) top owners are retail investors with 48% stake, while 30% is held by insidersKey Insights The considerable ownership by retail investors in P.A.M. Transportation Services indicates that they... |
P.A.M. Transportation Services, Inc. Announces Results for the First Quarter Ended March 31, 2023TONTITOWN, Ark., April 24, 2023--P.A.M. Transportation Services, Inc. (NASDAQ: PTSI) ("the Company") today reported net income of $5.2 million, or diluted earnings per share of $0.23 ($0.24 basic), for the quarter ended March 31, 2023. These results compare to net income of $23.9 million, or diluted earnings per share of $1.06 ($1.07 basic), for the quarter ended March 31, 2022. Net income and diluted earnings per share for both the first quarter ended March 31, 2023, and the first quarter ended |
Is P.A.M. Transportation Services, Inc.'s (NASDAQ:PTSI) Stock's Recent Performance A Reflection Of Its Financial Health?Most readers would already know that P.A.M. Transportation Services' (NASDAQ:PTSI) stock increased by 9.5% over the... |
Under The Bonnet, P.A.M. Transportation Services' (NASDAQ:PTSI) Returns Look ImpressiveIf we want to find a potential multi-bagger, often there are underlying trends that can provide clues. One common... |
Investors in P.A.M. Transportation Services (NASDAQ:PTSI) have made a impressive return of 248% over the past three yearsThe most you can lose on any stock (assuming you don't use leverage) is 100% of your money. But if you buy shares in a... |
PTSI Price Returns
1-mo | 14.30% |
3-mo | -11.52% |
6-mo | -7.30% |
1-year | -9.96% |
3-year | 201.97% |
5-year | 152.43% |
YTD | -0.93% |
2022 | -27.05% |
2021 | 189.84% |
2020 | -15.09% |
2019 | 46.43% |
2018 | 14.46% |
Continue Researching PTSI
Want to do more research on Pam Transportation Services Inc's stock and its price? Try the links below:Pam Transportation Services Inc (PTSI) Stock Price | Nasdaq
Pam Transportation Services Inc (PTSI) Stock Quote, History and News - Yahoo Finance
Pam Transportation Services Inc (PTSI) Stock Price and Basic Information | MarketWatch
Loading social stream, please wait...