
PowerFleet (PWFL): Price and Financial Metrics
PWFL Price/Volume Stats
| Current price | $4.57 | 52-week high | $5.67 |
| Prev. close | $4.56 | 52-week low | $1.64 |
| Day low | $4.38 | Volume | 13,698,600 |
| Day high | $4.71 | Avg. volume | 759,675 |
| 50-day MA | $4.82 | Dividend yield | N/A |
| 200-day MA | $3.37 | Market Cap | 490.59M |
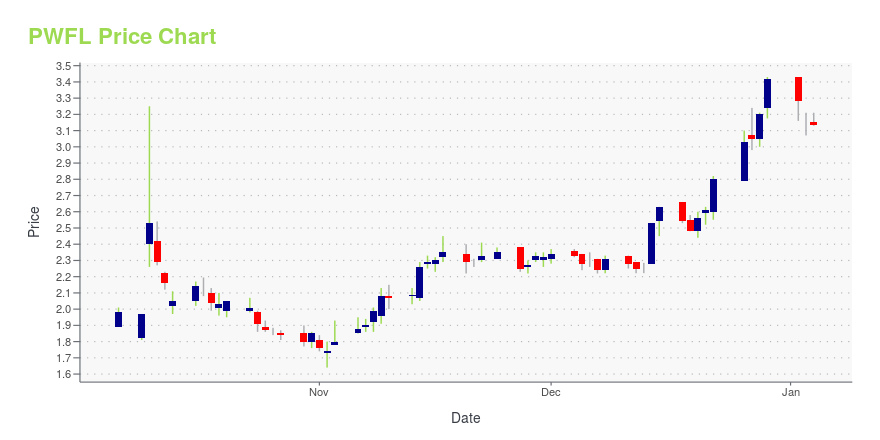
PWFL Stock Price Chart Interactive Chart >
PowerFleet (PWFL) Company Bio
PowerFleet (formerly I.D. Systems, Inc.) develops, markets, and sells wireless machine-to-machine solutions in the United States and internationally. The company offers integrated wireless solutions that utilize radio frequency identification, Wi-Fi, satellite or cellular communications, sensor technologies, and software to control, track, monitor, and analyze industrial vehicles, rental vehicles, and transportation assets. The company was founded in 1993 and is based in Woodcliff Lake, New Jersey.
Latest PWFL News From Around the Web
Below are the latest news stories about POWERFLEET INC that investors may wish to consider to help them evaluate PWFL as an investment opportunity.
Powerfleet Launches AI-Powered Solution to Revolutionize Pedestrian SafetyPowerfleet, Inc. (Nasdaq: PWFL) today launched its next-generation Pedestrian Proximity Detection solution, an artificial intelligence (AI)-powered safety system that proactively prevents accidents, bolsters pedestrian safety, and mitigates damage to material handling equipment (MHE) within warehouses and manufacturing facilities. Using AI-led object detection, the solution identifies people and MHE in its path, provides visual and audio alerts of potential hazards, and fosters an enhanced safet |
Powerfleet Named a Top Innovator by ABI ResearchPowerfleet, Inc. (Nasdaq: PWFL) today announced it was named a top innovator in ABI Research's Commercial Video Telematics Competitive Ranking. This influential report is designed to provide critical insights, research, and strategic advice for vendor decision-making in the video telematics and mobile asset IoT SaaS industry. ABI is a global technology advisory firm with research focused on transformative technologies that are dramatically reshaping industries, economies, and workforces. |
Penny Stock Powerhouses: 7 Picks Poised for Explosive GrowthUndeniably, the concept of growth penny stocks represent one of the hottest topics on Wall Street. |
MiX Telematics and Powerfleet to Present at the Raymond James TMT and Consumer Conference on December 5, 2023BOCA RATON, Fla. & WOODCLIFF LAKE, N.J., November 29, 2023--MiX Telematics Limited (NYSE: MIXT, JSE: MIX) and Powerfleet (Nasdaq: PWFL) announced that they will be presenting at the Raymond James TMT and Consumer Conference being held December 4-6, 2023, at the Lotte New York Palace in New York, NY. |
PowerFleet, Inc. (NASDAQ:PWFL) Q3 2023 Earnings Call TranscriptPowerFleet, Inc. (NASDAQ:PWFL) Q3 2023 Earnings Call Transcript November 9, 2023 PowerFleet, Inc. misses on earnings expectations. Reported EPS is $-0.14 EPS, expectations were $-0.04. Operator: Good morning. Welcome to PowerFleet’s Third Quarter 2023 Conference Call. Joining us for today’s presentation is the company’s CEO, Steve Towe, and CFO, David Wilson. Following their remarks, we […] |
PWFL Price Returns
| 1-mo | 3.63% |
| 3-mo | 0.88% |
| 6-mo | 51.83% |
| 1-year | 64.98% |
| 3-year | -31.17% |
| 5-year | -23.83% |
| YTD | 33.63% |
| 2023 | 27.14% |
| 2022 | -43.25% |
| 2021 | -36.20% |
| 2020 | 14.13% |
| 2019 | 16.46% |
Loading social stream, please wait...