
Quidel Corporation (QDEL): Price and Financial Metrics
QDEL Price/Volume Stats
| Current price | $38.91 | 52-week high | $89.11 |
| Prev. close | $38.24 | 52-week low | $29.74 |
| Day low | $38.04 | Volume | 1,159,802 |
| Day high | $39.76 | Avg. volume | 1,072,736 |
| 50-day MA | $37.49 | Dividend yield | N/A |
| 200-day MA | $52.97 | Market Cap | 2.61B |
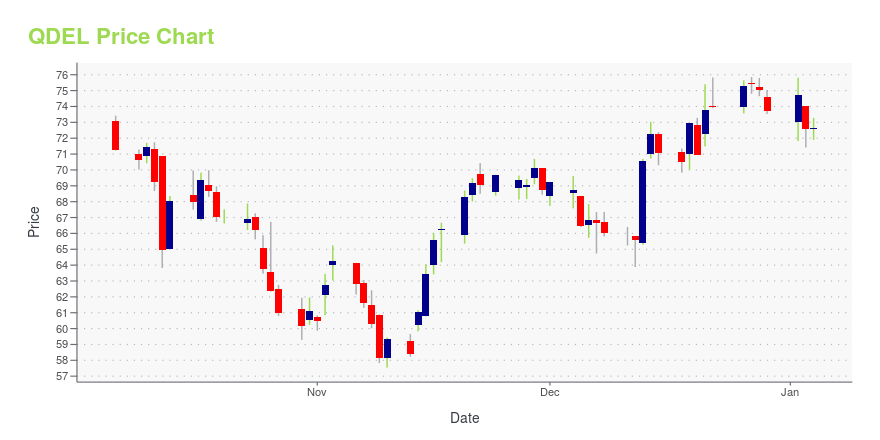
QDEL Stock Price Chart Interactive Chart >
Quidel Corporation (QDEL) Company Bio
Quidel Corporation develops, manufactures, and markets diagnostic testing solutions for applications primarily in infectious diseases, womens health, and gastrointestinal diseases. The company was founded in 1979 and is based in San Diego, California.
Latest QDEL News From Around the Web
Below are the latest news stories about QUIDELORTHO CORP that investors may wish to consider to help them evaluate QDEL as an investment opportunity.
Investors in QuidelOrtho (NASDAQ:QDEL) have unfortunately lost 59% over the last three yearsInvesting in stocks inevitably means buying into some companies that perform poorly. But the long term shareholders of... |
QuidelOrtho to Present at 42nd Annual J.P. Morgan Healthcare ConferenceSAN DIEGO, December 22, 2023--QuidelOrtho Corporation (NASDAQ:QDEL) ("QuidelOrtho"), a global provider of innovative in vitro diagnostics technologies designed for point-of-care settings, clinical labs and transfusion medicine, announced that Douglas Bryant, President and Chief Executive Officer, will present at the 42nd Annual J.P. Morgan Healthcare Conference on January 8, 2024, in San Francisco, CA, scheduled for 12:00 p.m. ET / 9:00 a.m. PT. |
QuidelOrtho Receives 510(K) Clearance for Savanna® Multiplex Molecular Platform and Savanna® HSV 1+2/VZV PCR AssaySAN DIEGO, December 20, 2023--QuidelOrtho Corporation (Nasdaq: QDEL) ("QuidelOrtho"), a global provider of innovative in vitro diagnostic technologies designed for point-of-care settings, clinical labs and transfusion medicine, has received 510(K) clearance from the U.S. Food and Drug Administration for its innovative Savanna PCR platform and Savanna HSV 1+2/VZV in vitro diagnostic test for the detection and differentiation of Herpes simplex virus type 1 (HSV-1), Herpes simplex virus type 2 (HSV |
Why is QuidelOrtho (QDEL) a Good Stock to Invest in?ClearBridge Investments, an investment management company, released its “ClearBridge All Cap Value Strategy” third quarter 2023 investor letter. A copy of the same can be downloaded here. The strategy outperformed the benchmark, the Russell 3000 Value Index, in the third quarter. Favorable stock selection in the consumer discretionary, healthcare, and utilities sectors, as well as an […] |
QuidelOrtho to Participate in the Evercore ISI ConferenceSAN DIEGO, November 16, 2023--QuidelOrtho Corporation (Nasdaq: QDEL) ("QuidelOrtho"), a global provider of innovative in vitro diagnostics technologies designed for point-of-care settings, clinical labs and transfusion medicine, announced today that members of its management team are scheduled to participate in the Evercore ISI conference in Miami, FL, on November 30, 2023. |
QDEL Price Returns
| 1-mo | 15.25% |
| 3-mo | -1.84% |
| 6-mo | -44.70% |
| 1-year | -55.07% |
| 3-year | -71.64% |
| 5-year | -33.89% |
| YTD | -47.20% |
| 2023 | -13.97% |
| 2022 | -36.54% |
| 2021 | -24.86% |
| 2020 | 139.44% |
| 2019 | 53.69% |
Continue Researching QDEL
Here are a few links from around the web to help you further your research on Quidel Corp's stock as an investment opportunity:Quidel Corp (QDEL) Stock Price | Nasdaq
Quidel Corp (QDEL) Stock Quote, History and News - Yahoo Finance
Quidel Corp (QDEL) Stock Price and Basic Information | MarketWatch
Loading social stream, please wait...