
Qilian International Holding Group Limited (QLI): Price and Financial Metrics
QLI Price/Volume Stats
| Current price | $6.15 | 52-week high | $6.69 |
| Prev. close | $6.49 | 52-week low | $1.78 |
| Day low | $6.15 | Volume | 2,769 |
| Day high | $6.25 | Avg. volume | 26,287 |
| 50-day MA | $4.19 | Dividend yield | N/A |
| 200-day MA | $3.25 | Market Cap | 43.97M |
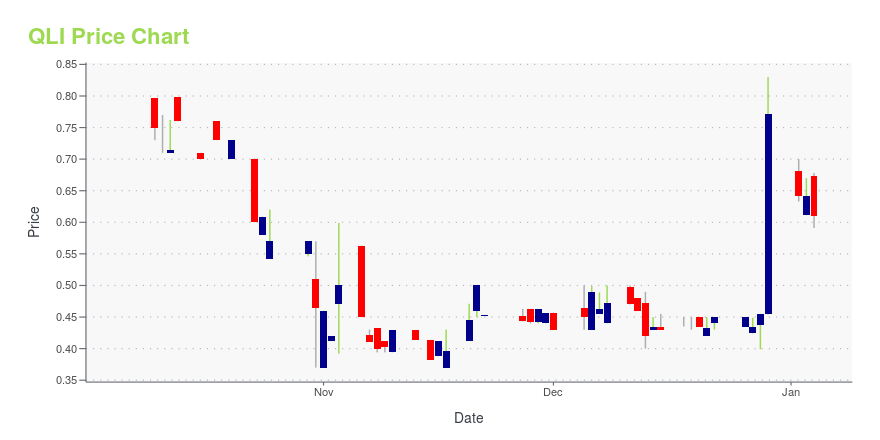
QLI Stock Price Chart Interactive Chart >
Qilian International Holding Group Limited (QLI) Company Bio
Qilian International Holding Group Limited operates as a holding company. The Company, through its subsidiaries, focuses in the research, development, and production of licorice and oxytetracycline products, medicine derivatives, sausage casings, and fertilizers. Qilian International Holding Group serves customers worldwide.
Latest QLI News From Around the Web
Below are the latest news stories about QILIAN INTERNATIONAL HOLDING GROUP LTD that investors may wish to consider to help them evaluate QLI as an investment opportunity.
Qilian International Holding Group First Half 2023 Earnings: EPS: US$0.014 (vs US$0.002 in 1H 2022)Qilian International Holding Group ( NASDAQ:QLI ) First Half 2023 Results Key Financial Results Revenue: US$29.2m (down... |
Qilian International Holding Group Ltd Receives Nasdaq Notification Regarding Minimum Bid Price DeficiencyQilian International Holding Group Ltd (NASDAQ: QLI) ("Qilian" or the "Company"), a China-based pharmaceutical and chemical products manufacturer, received notification (the "Notification Letter") from The Nasdaq Stock Market LLC ("Nasdaq"), dated July 13, 2023, that the Company is not in compliance with the minimum bid price requirement set forth in the Nasdaq Listing Rules for continued listing on The Nasdaq Global Market (the "Nasdaq Global Market"). The Notification Letter is only a notifica |
Qilian Received a Letter from Nasdaq Related to Regain ComplianceQilian International Holding Group Limited (NASDAQ: QLI) ("Qilian" or the "Company"), a China-based pharmaceutical and chemical products manufacturer, previously announced that on February 16, 2023, it received a written notice (the "Notice") from the Listing Qualifications Department of The Nasdaq Stock Market ("NASDAQ") indicating that the Company was not in compliance with NASDAQ Listing Rule 5250(c)(1) for continued listing (the "Rule") as a result of not having timely filed its annual repor |
Qilian Received Notification of Deficiency from Nasdaq Related to not timely Filing of Annual Report Form 20-FQilian International Holding Group Ltd (NASDAQ: QLI) ("Qilian" or the "Company"), a China-based pharmaceutical and chemical products manufacturer, today announced it has received a notice of non-compliance from Nasdaq Stock Market LLC ("Nasdaq") on February 16, 2023 stating that, as a result of not having timely filed its annual report on Form 20-F for the year ended September 30, 2022, Qilian is not in compliance with Nasdaq Listing Rule 5250(c)(1), which requires timely filing of periodic fina |
Qilian International Holding Group Ltd Declares Special Cash Dividends to ShareholdersQilian International Holding Group Ltd (the "Company" or Nasdaq: QLI), a China-based pharmaceutical and chemical products manufacturer, announced today that the Company has declared a special one-time cash dividend of $0.05 per ordinary share, payable in cash on or about March 6, 2023, to shareholders of record on February 28, 2023. |
QLI Price Returns
| 1-mo | 101.64% |
| 3-mo | 64.31% |
| 6-mo | 123.56% |
| 1-year | 41.90% |
| 3-year | -69.48% |
| 5-year | N/A |
| YTD | 59.45% |
| 2023 | 4.40% |
| 2022 | -72.12% |
| 2021 | N/A |
| 2020 | N/A |
| 2019 | N/A |
Loading social stream, please wait...