Qualys, Inc. (QLYS): Price and Financial Metrics
GET POWR RATINGS... FREE!
QLYS POWR Grades
- QLYS scores best on the Quality dimension, with a Quality rank ahead of 99.94% of US stocks.
- The strongest trend for QLYS is in Value, which has been heading up over the past 179 days.
- QLYS ranks lowest in Sentiment; there it ranks in the 4th percentile.
QLYS Stock Summary
- QLYS's current price/earnings ratio is 43.18, which is higher than 84.79% of US stocks with positive earnings.
- With a price/sales ratio of 9.35, QUALYS INC has a higher such ratio than 87.12% of stocks in our set.
- With a year-over-year growth in debt of -19.45%, QUALYS INC's debt growth rate surpasses just 15.42% of about US stocks.
- Stocks with similar financial metrics, market capitalization, and price volatility to QUALYS INC are ALGM, CODX, KIND, OUST, and HLTH.
- QLYS's SEC filings can be seen here. And to visit QUALYS INC's official web site, go to www.qualys.com.
QLYS Valuation Summary
- QLYS's price/sales ratio is 9.3; this is 250.94% higher than that of the median Technology stock.
- Over the past 126 months, QLYS's price/sales ratio has gone up 4.2.
Below are key valuation metrics over time for QLYS.
Stock | Date | P/S | P/B | P/E | EV/EBIT |
---|---|---|---|---|---|
QLYS | 2023-01-27 | 9.3 | 12.2 | 42.7 | 32.4 |
QLYS | 2023-01-26 | 9.2 | 12.2 | 42.5 | 32.3 |
QLYS | 2023-01-25 | 9.0 | 11.9 | 41.6 | 31.5 |
QLYS | 2023-01-24 | 9.0 | 11.8 | 41.4 | 31.4 |
QLYS | 2023-01-23 | 9.1 | 12.0 | 42.0 | 31.8 |
QLYS | 2023-01-20 | 8.9 | 11.7 | 40.9 | 31.0 |
QLYS Growth Metrics
- Its 4 year net cashflow from operations growth rate is now at 102.28%.
- Its 2 year net income to common stockholders growth rate is now at 28.59%.
- The 3 year net cashflow from operations growth rate now stands at 74.89%.

The table below shows QLYS's growth in key financial areas (numbers in millions of US dollars).
Date | Revenue | Operating Cash Flow | Net Income to Common Stock |
---|---|---|---|
2022-09-30 | 468.654 | 194.885 | 101.487 |
2022-06-30 | 448.027 | 201.227 | 101.596 |
2022-03-31 | 427.836 | 221.802 | 96.142 |
2021-12-31 | 411.172 | 200.616 | 70.96 |
2021-09-30 | 396.193 | 199.53 | 72.955 |
2021-06-30 | 384.328 | 210.677 | 67.929 |
QLYS's Quality Factors
The “Quality” component of the POWR Ratings focuses on 31 different factors of a companies fundamentals and operational strength. Here are some key insights as we drill into the specifics of these quality attributes.- QLYS has a Quality Grade of A, ranking ahead of 98.94% of graded US stocks.
- QLYS's asset turnover comes in at 0.528 -- ranking 310th of 561 Business Services stocks.
- SMSI, HEES, and APPF are the stocks whose asset turnover ratios are most correlated with QLYS.
The table below shows QLYS's key quality metrics over time.
Period | Asset Turnover | Gross Margin | ROIC |
---|---|---|---|
2021-06-30 | 0.528 | 0.779 | 0.194 |
2021-03-31 | 0.519 | 0.779 | 0.189 |
2020-12-31 | 0.512 | 0.782 | 0.259 |
2020-09-30 | 0.509 | 0.787 | 0.258 |
2020-06-30 | 0.509 | 0.791 | 0.261 |
2020-03-31 | 0.505 | 0.789 | 0.243 |
QLYS Price Target
For more insight on analysts targets of QLYS, see our QLYS price target page. And for a list of of all stocks sorted by upside potential based on analyst target price, see our Top Price Target page.
Average Price Target | $113.92 | Average Broker Recommendation | 1.93 (Hold) |
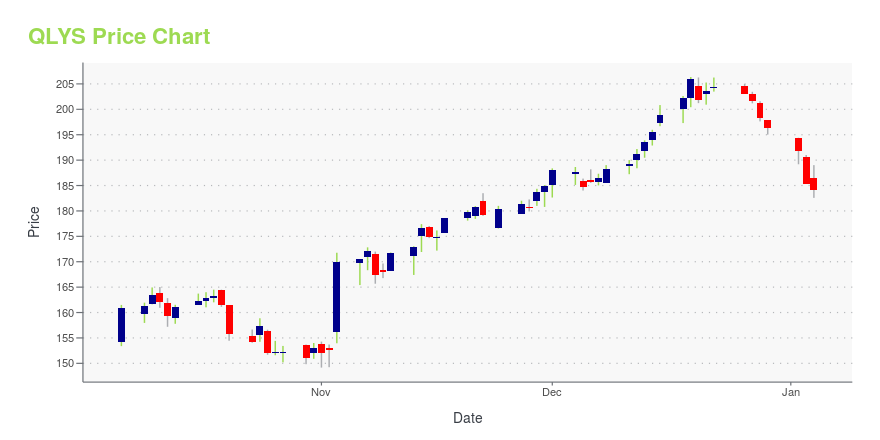
QLYS Stock Price Chart Interactive Chart >
QLYS Price/Volume Stats
Current price | $115.36 | 52-week high | $162.36 |
Prev. close | $112.01 | 52-week low | $101.10 |
Day low | $112.20 | Volume | 377,200 |
Day high | $115.54 | Avg. volume | 330,740 |
50-day MA | $114.04 | Dividend yield | N/A |
200-day MA | $129.52 | Market Cap | 4.38B |
Qualys, Inc. (QLYS) Company Bio
Qualys Inc. provides cloud security and compliance solutions in the United States and internationally. The Company's solutions enable organizations to identify security risks to their information technology infrastructures, help protect their IT systems and applications from cyber attacks. The company was founded in 1999 and is based in Redwood City, California.
Latest QLYS News From Around the Web
Below are the latest news stories about QUALYS INC that investors may wish to consider to help them evaluate QLYS as an investment opportunity.
Qualys Is Everything I Want To See In A Growth Stock |
Is Qualys (QLYS) a Good Long-Term Bet?Polen Capital, an investment management company, released its “Polen U.S. Small Company Growth Strategy” fourth-quarter investor letter. A copy of the same can be downloaded here. In the fourth quarter, the fund delivered 3.46% net of fees compared to a 4.13% return for the Russell 2000 Growth Index. Style factor headwinds and relative sector positioning offset […] |
Qualys (QLYS) Gains But Lags Market: What You Should KnowQualys (QLYS) closed the most recent trading day at $102.73, moving +0.85% from the previous trading session. |
Qualys cut to Hold at Needham due to ''soft'' field checks, disappointing Q3Needham analyst Alex Henderson downgraded Qualys (QLYS) to Hold from Buy and says that he is moving to the sidelines as his recent field checks into the company''s business were "soft" |
Qualys (QLYS) Dips More Than Broader Markets: What You Should KnowQualys (QLYS) closed at $111.51 in the latest trading session, marking a -0.64% move from the prior day. |
QLYS Price Returns
1-mo | N/A |
3-mo | 2.65% |
6-mo | -9.71% |
1-year | -10.28% |
3-year | 34.55% |
5-year | 85.62% |
YTD | 2.79% |
2022 | -18.21% |
2021 | 12.60% |
2020 | 46.18% |
2019 | 11.55% |
2018 | 25.93% |
Continue Researching QLYS
Here are a few links from around the web to help you further your research on Qualys Inc's stock as an investment opportunity:Qualys Inc (QLYS) Stock Price | Nasdaq
Qualys Inc (QLYS) Stock Quote, History and News - Yahoo Finance
Qualys Inc (QLYS) Stock Price and Basic Information | MarketWatch
Loading social stream, please wait...