
Quantum Corporation (QMCO): Price and Financial Metrics
QMCO Price/Volume Stats
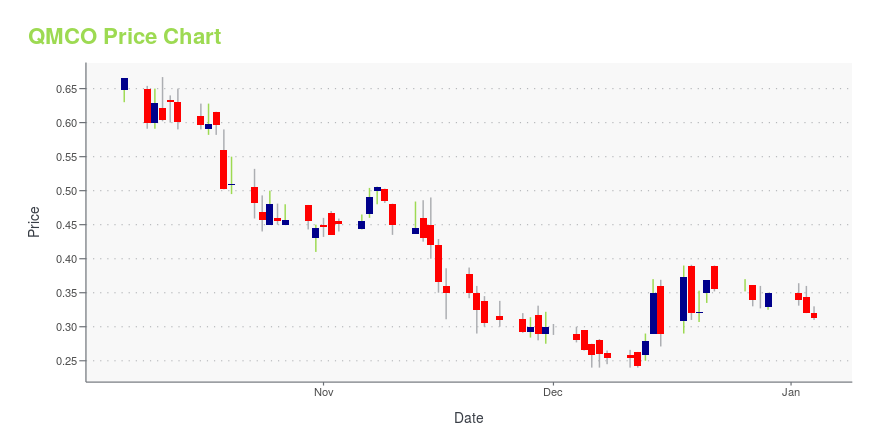
| Current price | $0.40 | 52-week high | $1.17 |
| Prev. close | $0.39 | 52-week low | $0.24 |
| Day low | $0.39 | Volume | 184,137 |
| Day high | $0.42 | Avg. volume | 422,074 |
| 50-day MA | $0.46 | Dividend yield | N/A |
| 200-day MA | $0.44 | Market Cap | 38.33M |
QMCO Stock Price Chart Interactive Chart >
Quantum Corporation (QMCO) Company Bio
Quantum Corporation sells scale-out storage, archive, and data protection solutions for capturing, sharing, and preserving digital assets in physical and virtual environments. The Company provides storage file systems, nearline storage systems, backup, and de-duplication appliances, tape libraries, and cloud services.
Latest QMCO News From Around the Web
Below are the latest news stories about QUANTUM CORP that investors may wish to consider to help them evaluate QMCO as an investment opportunity.
MR Datentechnik Builds a Scalable, S3-Compatible Storage Service with Quantum ActiveScale to Drive New Revenue StreamsQuantum, the leader in solutions for unstructured data, today announced that MR Datentechnik, a leading German IT solutions and managed services provider, has implemented Quantum ActiveScale™ object storage as the foundation of their new MR S3 Storage Service supporting customers' needs for backup and recovery, archiving, and data security. MR Datentechnik offers a resilient, highly scalable service providing customers with seamless, simple data storage, protection, and access at predictable and |
Radware Announces New Appointment to Its Board of DirectorsTEL AVIV, Israel, Nov. 30, 2023 (GLOBE NEWSWIRE) -- Radware® (NASDAQ: RDWR), a leading provider of cyber security and application delivery solutions, today announced that it has appointed Mr. Alex Pinchev to serve as an independent director of Radware’s Board of Directors. Mr. Pinchev will serve as a member of the Board until the company’s next annual meeting of shareholders when his appointment will be up to a shareholder vote. “Mr. Pinchev brings a wealth of experience to Radware’s board,” sai |
Quantum Myriad™ All-Flash File and Object Solution Now Generally AvailableQuantum Corporation (NASDAQ: QMCO), the leader in solutions for video and unstructured data, announces that Quantum Myriad™, an all-flash, scale-out file and object storage software platform for the enterprise, is now generally available for purchase. First released to early-access customers in April of this year, Myriad has demonstrated in testing that it delivers deployment flexibility and consistent high performance for data intensive workloads. This is in large part due to its modern cloud-n |
Quantum Announces Notification from Nasdaq Related to Delayed Form 10-Q FilingQuantum Corporation (NASDAQ: QMCO) ("Quantum" or the "Company") announced today that it received a notice (the "Notice") from the Listing Qualifications staff of the Nasdaq Stock Market LLC ("Nasdaq") on November 14, 2023 stating that the Company is not in compliance with Nasdaq Listing Rule 5250(c)(1) as a result of the Company's delay in filing its Quarterly Report on Form 10-Q for the fiscal quarter ended September 30, 2023 (the "Quarterly Report") with the Securities and Exchange Commission. |
Quantum Files Form 12b-25 Notification of Late filingQuantum Corporation (NASDAQ: QMCO) ("Quantum or the "Company") announced today that it has filed a Form 12b-25 Notification of Late Filing because it is unable to file its Quarterly Report on Form 10-Q for the quarter ended September 30, 2023 (the "Form 10-Q") by November 9, 2023, the original due date for such filing. As a result, Quantum is postponing its fiscal 2024 second quarter earnings announcement and conference call, which are typically held in the second week of November. |
QMCO Price Returns
| 1-mo | -9.58% |
| 3-mo | -4.76% |
| 6-mo | 12.01% |
| 1-year | -61.54% |
| 3-year | -93.62% |
| 5-year | -87.42% |
| YTD | 14.61% |
| 2023 | -67.98% |
| 2022 | -80.25% |
| 2021 | -9.80% |
| 2020 | -17.52% |
| 2019 | 271.00% |
Loading social stream, please wait...