Q2 Holdings, Inc. (QTWO): Price and Financial Metrics
GET POWR RATINGS... FREE!
QTWO POWR Grades
- QTWO scores best on the Growth dimension, with a Growth rank ahead of 92.5% of US stocks.
- The strongest trend for QTWO is in Stability, which has been heading down over the past 179 days.
- QTWO's current lowest rank is in the Momentum metric (where it is better than 1.65% of US stocks).
QTWO Stock Summary
- QTWO's one year PEG ratio, measuring expected growth in earnings next year relative to current common stock price is 359.24 -- higher than 92.77% of US-listed equities with positive expected earnings growth.
- Price to trailing twelve month operating cash flow for QTWO is currently 60.58, higher than 92.8% of US stocks with positive operating cash flow.
- In terms of volatility of its share price, QTWO is more volatile than 75.75% of stocks we're observing.
- Stocks with similar financial metrics, market capitalization, and price volatility to Q2 HOLDINGS INC are QUIK, RAMP, BLZE, LQDA, and CODX.
- Visit QTWO's SEC page to see the company's official filings. To visit the company's web site, go to www.q2ebanking.com.
QTWO Valuation Summary
- QTWO's price/sales ratio is 3.4; this is 28.3% higher than that of the median Technology stock.
- QTWO's price/sales ratio has moved down 5.1 over the prior 108 months.
Below are key valuation metrics over time for QTWO.
Stock | Date | P/S | P/B | P/E | EV/EBIT |
---|---|---|---|---|---|
QTWO | 2023-01-27 | 3.4 | 4.4 | -18.5 | -28.2 |
QTWO | 2023-01-26 | 3.3 | 4.3 | -18.0 | -27.6 |
QTWO | 2023-01-25 | 3.3 | 4.2 | -17.7 | -27.3 |
QTWO | 2023-01-24 | 3.3 | 4.3 | -18.1 | -27.7 |
QTWO | 2023-01-23 | 3.4 | 4.4 | -18.6 | -28.2 |
QTWO | 2023-01-20 | 3.3 | 4.3 | -18.0 | -27.6 |
QTWO Growth Metrics
- Its 2 year price growth rate is now at -41.61%.
- Its 3 year net cashflow from operations growth rate is now at 3814.04%.
- The 2 year cash and equivalents growth rate now stands at 164.1%.

The table below shows QTWO's growth in key financial areas (numbers in millions of US dollars).
Date | Revenue | Operating Cash Flow | Net Income to Common Stock |
---|---|---|---|
2022-09-30 | 551.022 | 31.065 | -101.953 |
2022-06-30 | 533.007 | 10.521 | -105.745 |
2022-03-31 | 516.271 | 31.782 | -110.65 |
2021-12-31 | 498.72 | 30.925 | -112.746 |
2021-09-30 | 475.815 | 10.703 | -125.186 |
2021-06-30 | 452.883 | 30.333 | -120.323 |
QTWO's Quality Factors
The “Quality” component of the POWR Ratings focuses on 31 different factors of a companies fundamentals and operational strength. Here are some key insights as we drill into the specifics of these quality attributes.- QTWO has a Quality Grade of D, ranking ahead of 12.33% of graded US stocks.
- QTWO's asset turnover comes in at 0.329 -- ranking 416th of 561 Business Services stocks.
- ENV, HIL, and TGH are the stocks whose asset turnover ratios are most correlated with QTWO.
The table below shows QTWO's key quality metrics over time.
Period | Asset Turnover | Gross Margin | ROIC |
---|---|---|---|
2021-06-30 | 0.329 | 0.440 | -0.112 |
2021-03-31 | 0.315 | 0.442 | -0.137 |
2020-12-31 | 0.323 | 0.434 | -0.166 |
2020-09-30 | 0.332 | 0.452 | -0.171 |
2020-06-30 | 0.334 | 0.463 | -0.162 |
2020-03-31 | 0.342 | 0.470 | -0.132 |
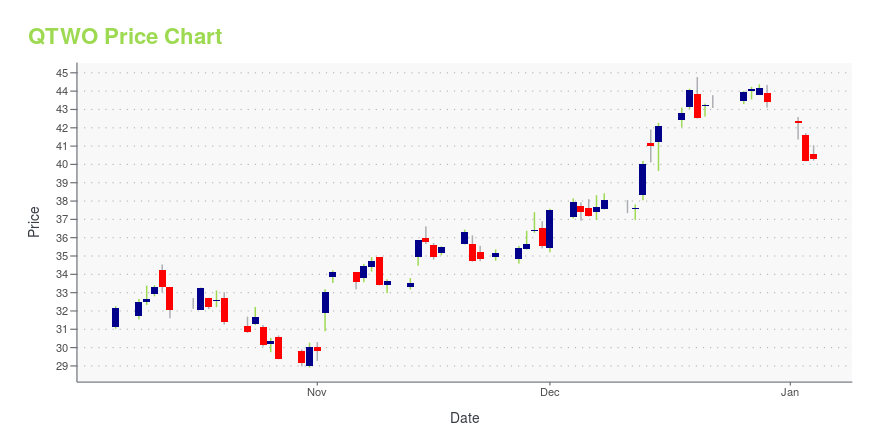
QTWO Stock Price Chart Interactive Chart >
QTWO Price/Volume Stats
Current price | $32.60 | 52-week high | $67.77 |
Prev. close | $32.72 | 52-week low | $20.93 |
Day low | $32.52 | Volume | 35,544 |
Day high | $33.14 | Avg. volume | 374,062 |
50-day MA | $28.10 | Dividend yield | N/A |
200-day MA | $37.19 | Market Cap | 1.88B |
Q2 Holdings, Inc. (QTWO) Company Bio
Q2 Holdings provides secure cloud-based virtual banking solutions to regional and community financial institutions (RCFIs). The company was founded in 2005 and is based in Austin, Texas.
Latest QTWO News From Around the Web
Below are the latest news stories about Q2 HOLDINGS INC that investors may wish to consider to help them evaluate QTWO as an investment opportunity.
What Makes Q2 Holdings (QTWO) a New Strong Buy StockQ2 Holdings (QTWO) has been upgraded to a Zacks Rank #1 (Strong Buy), reflecting growing optimism about the company's earnings prospects. This might drive the stock higher in the near term. |
Estimating The Intrinsic Value Of Q2 Holdings, Inc. (NYSE:QTWO)In this article we are going to estimate the intrinsic value of Q2 Holdings, Inc. ( NYSE:QTWO ) by estimating the... |
Built In Honors Q2 with 2023 Best Places to Work AwardAUSTIN, Texas, January 25, 2023--Q2 Holdings, Inc. (NYSE:QTWO), a leading provider of digital transformation solutions for banking and lending, today announced it was honored in Built In’s 2023 Best Places to Work Awards. Q2 earned a place on the following lists: U.S. 100 Best Large Places to Work, Austin 100 Best Places to Work, Austin 100 Best Large Places to Work, Atlanta 100 Best Places to Work and Atlanta 100 Best Large Places to Work. The annual awards program includes companies of all siz |
Q2 Announces 2023 State of Commercial Banking Market ReportAUSTIN, Texas, January 19, 2023--Q2 Holdings, Inc. (NYSE:QTWO), a leading provider of digital transformation solutions for banking and lending, will release its 2023 State of Commercial Banking Market Analysis Report on Thursday, Jan. 26, following The State of Commercial Banking webinar at 2 p.m. CST. The report, based on insights mined from Q2’s proprietary databases, is an annual review of the major trends in the commercial banking industry from the previous 12 months, as well as a look at th |
Helix Named Best Overall Embedded Platform by TearsheetAUSTIN, Texas, December 23, 2022--Helix by Q2 (NYSE:QTWO), a cloud-native core purpose-built for embedded finance, today announced it has been named a winner of the Tearsheet Embedded Award in the Best Overall Embedded Platform category. This marks the first time Helix has won the Tearsheet Award, recognizing its innovative approach to humanizing embedded finance through personalized banking solutions. The winners of the 2022 Embedded Awards were announced at Tearsheet’s annual The Big Bank Theo |
QTWO Price Returns
1-mo | N/A |
3-mo | 18.72% |
6-mo | -25.77% |
1-year | -49.74% |
3-year | -62.61% |
5-year | -23.29% |
YTD | 21.32% |
2022 | -66.18% |
2021 | -37.22% |
2020 | 56.06% |
2019 | 63.63% |
2018 | 34.46% |
Continue Researching QTWO
Here are a few links from around the web to help you further your research on Q2 Holdings Inc's stock as an investment opportunity:Q2 Holdings Inc (QTWO) Stock Price | Nasdaq
Q2 Holdings Inc (QTWO) Stock Quote, History and News - Yahoo Finance
Q2 Holdings Inc (QTWO) Stock Price and Basic Information | MarketWatch
Loading social stream, please wait...