
Ryder System, Inc. (R): Price and Financial Metrics
R Price/Volume Stats
| Current price | $121.95 | 52-week high | $123.45 |
| Prev. close | $122.43 | 52-week low | $76.15 |
| Day low | $121.00 | Volume | 224,600 |
| Day high | $123.19 | Avg. volume | 265,485 |
| 50-day MA | $114.83 | Dividend yield | 2.32% |
| 200-day MA | $107.20 | Market Cap | 5.34B |
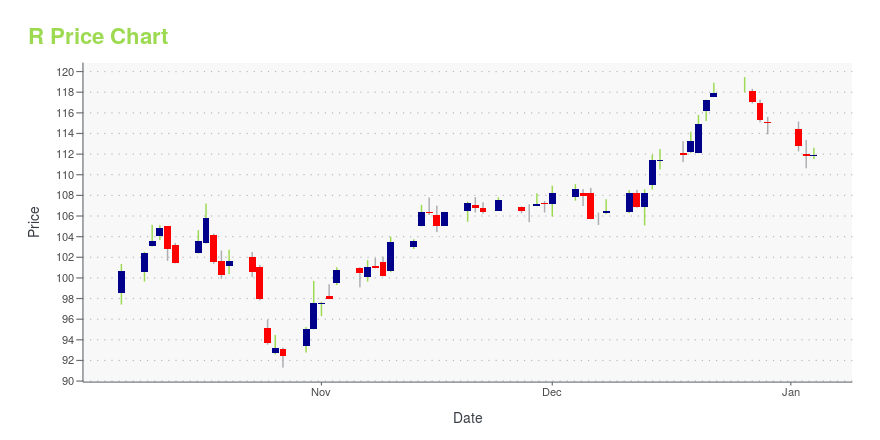
R Stock Price Chart Interactive Chart >
Ryder System, Inc. (R) Company Bio
Ryder System provides commercial fleet management and supply chain solutions to small businesses and large enterprises worldwide. The company operates in two segments: Fleet Management Solutions and Supply Chain Solutions. The Fleet Management Solutions segment provides service leasing, commercial rental, contract maintenance, and contract-related maintenance of trucks, tractors and trailers to customers in the United States, Canada and the United Kingdom. The Supply Chain Solutions segment provides supply chain solutions, including distribution and transportation services in North America and Asia. The company was founded in 1933 and is based in Miami, Florida.
Latest R News From Around the Web
Below are the latest news stories about RYDER SYSTEM INC that investors may wish to consider to help them evaluate R as an investment opportunity.
Ryder (R) Benefits From Dividends, Buyback Amid High CapexWhile encouraging 2023 earnings outlook and shareholder-friendly moves raise optimism about Ryder (R), high capital expenditures and weak liquidity position raise concern about the stock. |
Ryder Earns Military Times' 2023 Best for Vets DesignationMIAMI, December 07, 2023--Ryder System, Inc. (NYSE: R), a leader in supply chain, dedicated transportation, and fleet management solutions, has been recognized by Military Times as one of the Best for Vets: Employers. This is Ryder’s third consecutive year making this top companies list for veterans. |
Ryder Signs First Customers to Multi-Year Electric Vehicle ContractsMIAMI, December 05, 2023--Ryder System, Inc. (NYSE: R), a leader in supply chain, dedicated transportation, and fleet management solutions, secures its first two Ryder ChoiceLease customers under the RyderElectric+ turnkey fleet solution. Pompano Beach, Fla.-based Land ‘N’ Sea Distributing, the nation’s largest marine and recreation vehicle parts distributor, and Servientrega International Inc., a Bogota, Colombia-based parcel logistics company with operations in Miami, will be using RyderElectr |
Ryder (R) Touches 52-Week High: What's Driving the Stock?Ryder (R) expects full-year adjusted earnings per share between $12.60 and $12.85 (prior view: $12.20 and $12.70). |
Ryder Sets New Giving Record with $1.1 Million Donation to United WayMIAMI, November 29, 2023--Ryder System, Inc. (NYSE: R), a leader in supply chain, dedicated transportation, and fleet management solutions, announces the company’s annual United Way workplace campaign contributions for 2023 totaled $1.1 million—setting another record in the company’s more than 40-year history supporting United Way. The 2023 donation includes employee pledges and a contribution from the Ryder Charitable Foundation. |
R Price Returns
| 1-mo | 1.46% |
| 3-mo | 5.68% |
| 6-mo | 30.00% |
| 1-year | 58.48% |
| 3-year | 71.73% |
| 5-year | 123.13% |
| YTD | 6.68% |
| 2023 | 41.61% |
| 2022 | 4.38% |
| 2021 | 37.59% |
| 2020 | 20.15% |
| 2019 | 17.42% |
R Dividends
| Ex-Dividend Date | Type | Payout Amount | Change | ||||||
|---|---|---|---|---|---|---|---|---|---|
| Loading, please wait... | |||||||||
Continue Researching R
Want to do more research on Ryder System Inc's stock and its price? Try the links below:Ryder System Inc (R) Stock Price | Nasdaq
Ryder System Inc (R) Stock Quote, History and News - Yahoo Finance
Ryder System Inc (R) Stock Price and Basic Information | MarketWatch
Loading social stream, please wait...