Royal Caribbean Group (RCL): Price and Financial Metrics
RCL Price/Volume Stats
Current price | $92.14 | 52-week high | $112.95 |
Prev. close | $94.13 | 52-week low | $36.92 |
Day low | $91.15 | Volume | 3,992,200 |
Day high | $95.96 | Avg. volume | 3,514,089 |
50-day MA | $100.02 | Dividend yield | N/A |
200-day MA | $79.65 | Market Cap | 23.60B |
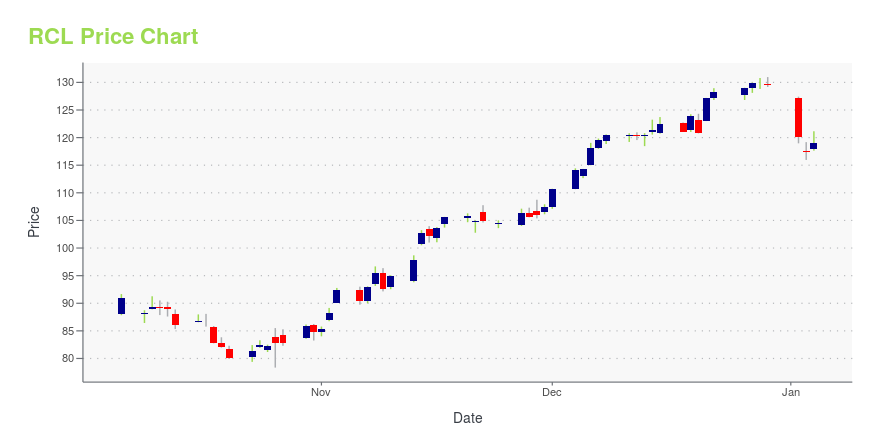
RCL Stock Price Chart Interactive Chart >
RCL POWR Grades
- Growth is the dimension where RCL ranks best; there it ranks ahead of 98.17% of US stocks.
- The strongest trend for RCL is in Quality, which has been heading up over the past 177 days.
- RCL's current lowest rank is in the Stability metric (where it is better than 12.08% of US stocks).
RCL Stock Summary
- ROYAL CARIBBEAN CRUISES LTD's market capitalization of $23,373,257,275 is ahead of 91.34% of US-listed equities.
- RCL's equity multiplier -- a measure of assets relative to shareholders'equity -- is greater than that of 91.05% of US stocks.
- As for revenue growth, note that RCL's revenue has grown 156.38% over the past 12 months; that beats the revenue growth of 96.24% of US companies in our set.
- If you're looking for stocks that are quantitatively similar to ROYAL CARIBBEAN CRUISES LTD, a group of peers worth examining would be CCL, CZR, MMP, IRM, and BGS.
- RCL's SEC filings can be seen here. And to visit ROYAL CARIBBEAN CRUISES LTD's official web site, go to www.rclinvestor.com.
RCL Valuation Summary
- In comparison to the median Industrials stock, RCL's price/sales ratio is 10.53% higher, now standing at 2.1.
- RCL's price/earnings ratio has moved down 463.3 over the prior 243 months.
Below are key valuation metrics over time for RCL.
Stock | Date | P/S | P/B | P/E | EV/EBIT |
---|---|---|---|---|---|
RCL | 2023-09-19 | 2.1 | 7.5 | -446.7 | 31.5 |
RCL | 2023-09-18 | 2.0 | 7.3 | -435.8 | 31.1 |
RCL | 2023-09-15 | 2.1 | 7.4 | -442.6 | 31.4 |
RCL | 2023-09-14 | 2.1 | 7.6 | -453.3 | 31.8 |
RCL | 2023-09-13 | 2.1 | 7.4 | -442.3 | 31.4 |
RCL | 2023-09-12 | 2.1 | 7.5 | -449.8 | 31.7 |
RCL Growth Metrics
- Its year over year net cashflow from operations growth rate is now at 66.29%.
- The 2 year revenue growth rate now stands at -75.82%.
- Its year over year price growth rate is now at -13.32%.

The table below shows RCL's growth in key financial areas (numbers in millions of US dollars).
Date | Revenue | Operating Cash Flow | Net Income to Common Stock |
---|---|---|---|
2022-12-31 | 8,840.54 | 481.857 | -2,155.962 |
2022-09-30 | 7,218.795 | -299.787 | -3,012.724 |
2022-06-30 | 4,682.678 | -658.468 | -4,470.246 |
2022-03-31 | 2,549.35 | -1,597.479 | -5,295.919 |
2021-12-31 | 1,532.133 | -1,877.815 | -5,260.499 |
2021-09-30 | 584.024 | -2,498.167 | -5,270.466 |
RCL's Quality Factors
The “Quality” component of the POWR Ratings focuses on 31 different factors of a companies fundamentals and operational strength. Here are some key insights as we drill into the specifics of these quality attributes.- RCL has a Quality Grade of F, ranking ahead of 4.16% of graded US stocks.
- RCL's asset turnover comes in at 0.018 -- ranking 133rd of 137 Transportation stocks.
- LIND, CCL, and UAL are the stocks whose asset turnover ratios are most correlated with RCL.
The table below shows RCL's key quality metrics over time.
Period | Asset Turnover | Gross Margin | ROIC |
---|---|---|---|
2021-09-30 | 0.018 | -2.060 | -0.088 |
2021-06-30 | 0.003 | -12.731 | -0.091 |
2021-03-31 | 0.007 | -6.052 | -0.101 |
2020-12-31 | 0.067 | -0.252 | -0.119 |
2020-09-30 | 0.146 | 0.151 | -0.090 |
2020-06-30 | 0.249 | 0.331 | -0.039 |
RCL Price Target
For more insight on analysts targets of RCL, see our RCL price target page. And for a list of of all stocks sorted by upside potential based on analyst target price, see our Top Price Target page.
Average Price Target | $91.54 | Average Broker Recommendation | 1.74 (Moderate Buy) |
Royal Caribbean Group (RCL) Company Bio
Royal Caribbean Group, formerly known as Royal Caribbean Cruises Ltd., is a global cruise holding company incorporated in Liberia and based in Miami, Florida, US. It is the world's second-largest cruise line operator, after Carnival Corporation & plc. As of January 2021, Royal Caribbean Group fully owns three cruise lines: Royal Caribbean International, Celebrity Cruises, and Silversea Cruises. They also hold a 50% stake in TUI Cruises and the now-defunct Pullmantur Cruises and CDF Croisières de France. Previously Royal Caribbean Group also fully owned Azamara Cruises selling the cruise line to Sycamore Partners in January 2021, and 50% of Island Cruises, selling their stake to TUI Travel PLC in October 2008. (Source:Wikipedia)
Latest RCL News From Around the Web
Below are the latest news stories about ROYAL CARIBBEAN CRUISES LTD that investors may wish to consider to help them evaluate RCL as an investment opportunity.
These Are The 12 Stocks Driving The S&P 500 Higher In 2023The S&P 500 is up 12.5% so far in 2023, even with the market correction. But an equal-weight ETF is up just 1%. Nvidia leads the index's big winners. |
Ralph Lauren (RL) Prioritizes Digital Investment, Stock to GainRalph Lauren's (RL) progress on digital and omni-channel investments to improve the experiences of target consumers. Its "Next Great Chapter" plan is on track. |
Carnival Corp. Set to Break Two Significant Streaks With Upcoming Fiscal Third-Quarter ResultsMonday, September 25, 2023 - Carnival (NYSE:CCL) Corp., the largest cruise line operator globally, is set to announce its fiscal third-quarter results this Friday, anticipated to mark the end of two significant trends for the company. |
Royal Caribbean shares pricing news customers won't likeThe cruise line has recently floated a lot of pricing ideas that have made passengers angry, but they may be missing the bigger story. |
Here's Why You Should Retain Planet Fitness (PLNT) StockPlanet Fitness (PLNT) emphasizes strategic initiatives to expand its presence. However, a volatile macroeconomic environment is a concern. |
RCL Price Returns
1-mo | -6.87% |
3-mo | -11.18% |
6-mo | 43.41% |
1-year | 143.11% |
3-year | 42.35% |
5-year | -25.93% |
YTD | 86.41% |
2022 | -35.72% |
2021 | 2.96% |
2020 | -43.50% |
2019 | 39.94% |
2018 | -16.13% |
Continue Researching RCL
Want to do more research on Royal Caribbean Cruises Ltd's stock and its price? Try the links below:Royal Caribbean Cruises Ltd (RCL) Stock Price | Nasdaq
Royal Caribbean Cruises Ltd (RCL) Stock Quote, History and News - Yahoo Finance
Royal Caribbean Cruises Ltd (RCL) Stock Price and Basic Information | MarketWatch
Loading social stream, please wait...