
Radcom Ltd. - Ordinary Shares (RDCM): Price and Financial Metrics
RDCM Price/Volume Stats
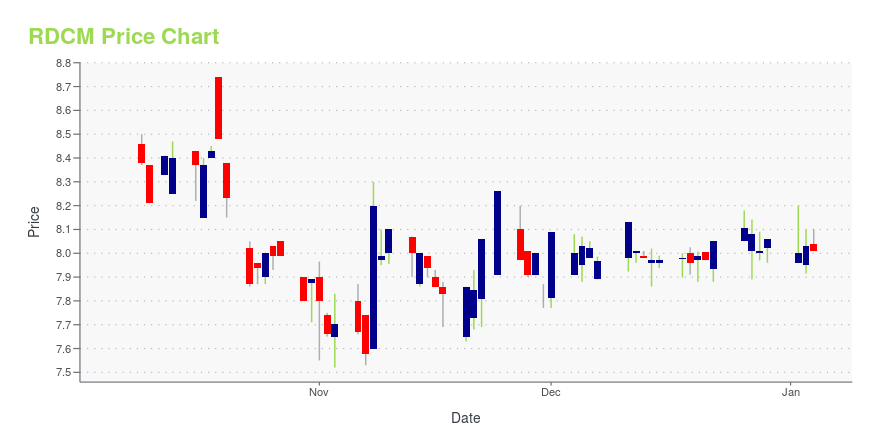
| Current price | $10.20 | 52-week high | $12.10 |
| Prev. close | $10.06 | 52-week low | $7.52 |
| Day low | $9.95 | Volume | 41,263 |
| Day high | $10.30 | Avg. volume | 34,394 |
| 50-day MA | $9.41 | Dividend yield | N/A |
| 200-day MA | $9.15 | Market Cap | 157.80M |
RDCM Stock Price Chart Interactive Chart >
Radcom Ltd. - Ordinary Shares (RDCM) Company Bio
Radcom Ltd. provides service assurance and customer experience monitoring solutions for telecom operators and communications service providers. The company was founded in 1985 and is based in Tel-Aviv, Israel.
Latest RDCM News From Around the Web
Below are the latest news stories about RADCOM LTD that investors may wish to consider to help them evaluate RDCM as an investment opportunity.
RADCOM Ltd. (NASDAQ:RDCM) Q3 2023 Earnings Call TranscriptRADCOM Ltd. (NASDAQ:RDCM) Q3 2023 Earnings Call Transcript November 8, 2023 RADCOM Ltd. beats earnings expectations. Reported EPS is $0.15, expectations were $0.07. Operator: Ladies and gentlemen, thank you for standing by. Welcome to the RADCOM Limited Results Conference Call for the Third Quarter of 2023. All participants are present in a listen-only mode. Following […] |
Radcom (RDCM) Q3 Earnings and Revenues Top EstimatesRadcom (RDCM) delivered earnings and revenue surprises of 114.29% and 3.90%, respectively, for the quarter ended September 2023. Do the numbers hold clues to what lies ahead for the stock? |
RADCOM Reports Third Quarter 2023 ResultsRADCOM Ltd. (Nasdaq: RDCM) announced financial results for the third quarter ended September 30, 2023. |
RADCOM to Present at the 17th Annual Needham Virtual Security, Networking, & Communications Conference on Tuesday, November 14RADCOM (Nasdaq: RDCM) today announced that RADCOM's Chief Executive Officer, Eyal Harari, will participate in an analyst-led fireside chat at the 17th Annual Needham Virtual Security, Networking, & Communications Conference on Tuesday, November 14, 2023. |
RADCOM to Report Third Quarter 2023 Results on November 8, 2023RADCOM Ltd. (NASDAQ: RDCM), today announced that it will report its financial results for the third quarter, which ended September 30, 2023, on Wednesday, November 8, 2023, before the opening of trade on the Nasdaq Stock Market. |
RDCM Price Returns
| 1-mo | 11.35% |
| 3-mo | 17.78% |
| 6-mo | 7.20% |
| 1-year | 6.47% |
| 3-year | -4.23% |
| 5-year | 27.82% |
| YTD | 26.55% |
| 2023 | -26.33% |
| 2022 | -16.17% |
| 2021 | 19.18% |
| 2020 | 28.52% |
| 2019 | 14.82% |
Continue Researching RDCM
Here are a few links from around the web to help you further your research on Radcom Ltd's stock as an investment opportunity:Radcom Ltd (RDCM) Stock Price | Nasdaq
Radcom Ltd (RDCM) Stock Quote, History and News - Yahoo Finance
Radcom Ltd (RDCM) Stock Price and Basic Information | MarketWatch
Loading social stream, please wait...