
Radian Group Inc. (RDN): Price and Financial Metrics
RDN Price/Volume Stats
| Current price | $37.01 | 52-week high | $37.06 |
| Prev. close | $36.44 | 52-week low | $24.56 |
| Day low | $36.50 | Volume | 660,021 |
| Day high | $37.06 | Avg. volume | 1,075,969 |
| 50-day MA | $31.93 | Dividend yield | 2.75% |
| 200-day MA | $29.42 | Market Cap | 5.57B |
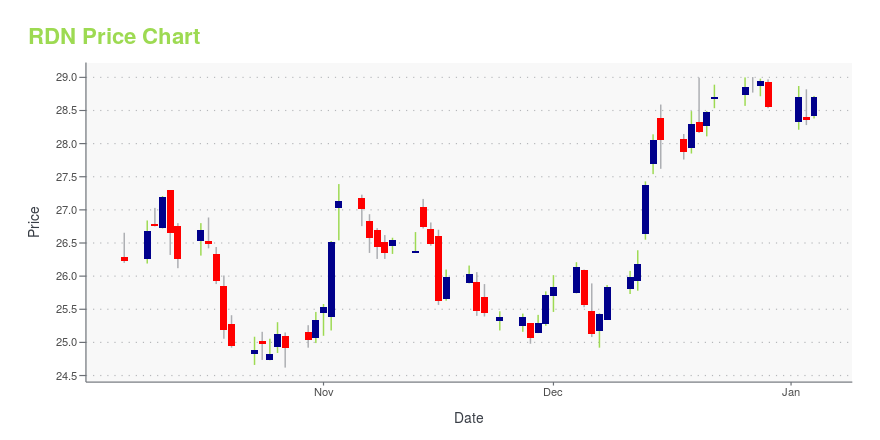
RDN Stock Price Chart Interactive Chart >
Radian Group Inc. (RDN) Company Bio
Radian Corporation provides private mortgage insurance and related risk mitigation products and services to mortgage lenders nationwide through its principal operating subsidiary, Radian Guaranty Inc.. The company was founded in 1977 and is based in Philadelphia, Pennsylvania.
Latest RDN News From Around the Web
Below are the latest news stories about RADIAN GROUP INC that investors may wish to consider to help them evaluate RDN as an investment opportunity.
15 Best Mortgage Insurance Companies Heading into 2024In this article, we will look into the 15 best mortgage insurance companies heading into 2024. If you want to skip our detailed analysis, you can go directly to the 5 Best Mortgage Insurance Companies Heading into 2024. Mortgage Insurance Market Shift According to an article by National Mortgage News, published on August 7, 2023, […] |
4 Insurers With 25% Gains in 2023 Still Have Room to RunBanking on strong fundamentals and benefiting from a favorable macro backdrop, AIZ, MTG, NMIH and RDN have not only outperformed the industry but have also crushed the market and the Finance sector. These companies are well-poised to sustain the bull run next year. |
Are Higher Prices Ahead for Radian Group?The mortgage insurance company was raised to an outperform (buy) fundamental recommendation at an investment banking firm. |
Microsoft started at Buy, MSCI raised to Overweight: 4 big analyst picksThe analysts pointed out Microsoft's early execution in the generative AI market and anticipate further growth as their projects evolve. The expectation is for Microsoft to see mid-teen increases in both revenue and FCF, driven by better-than-anticipated results in AI, Azure, and Copilot, potentially leading to continued robust stock performance. |
Radian Group (RDN) Up 39.8% in a Year: More Room for Growth?Radian Group (RDN) stock rallies on the back of improved persistency and mortgage insurance portfolio, robust capital position as well as prudent capital deployment. |
RDN Price Returns
| 1-mo | 20.99% |
| 3-mo | 22.89% |
| 6-mo | 28.61% |
| 1-year | 42.20% |
| 3-year | 85.12% |
| 5-year | 87.59% |
| YTD | 31.81% |
| 2023 | 55.31% |
| 2022 | -6.35% |
| 2021 | 6.97% |
| 2020 | -17.20% |
| 2019 | 53.84% |
RDN Dividends
| Ex-Dividend Date | Type | Payout Amount | Change | ||||||
|---|---|---|---|---|---|---|---|---|---|
| Loading, please wait... | |||||||||
Continue Researching RDN
Want to see what other sources are saying about Radian Group Inc's financials and stock price? Try the links below:Radian Group Inc (RDN) Stock Price | Nasdaq
Radian Group Inc (RDN) Stock Quote, History and News - Yahoo Finance
Radian Group Inc (RDN) Stock Price and Basic Information | MarketWatch
Loading social stream, please wait...