RadNet, Inc. (RDNT): Price and Financial Metrics

RadNet, Inc. (RDNT): $28.58

0.75 (+2.69%)

POWR Rating

Component Grades

Momentum

D

Stability

C

Sentiment

Quality

C

RDNT Price/Volume Stats

Current price $28.58 52-week high $35.18
Prev. close $27.83 52-week low $12.03
Day low $27.91 Volume 435,400
Day high $28.67 Avg. volume 425,639
50-day MA $31.15 Dividend yield N/A
200-day MA $26.72 Market Cap 1.94B

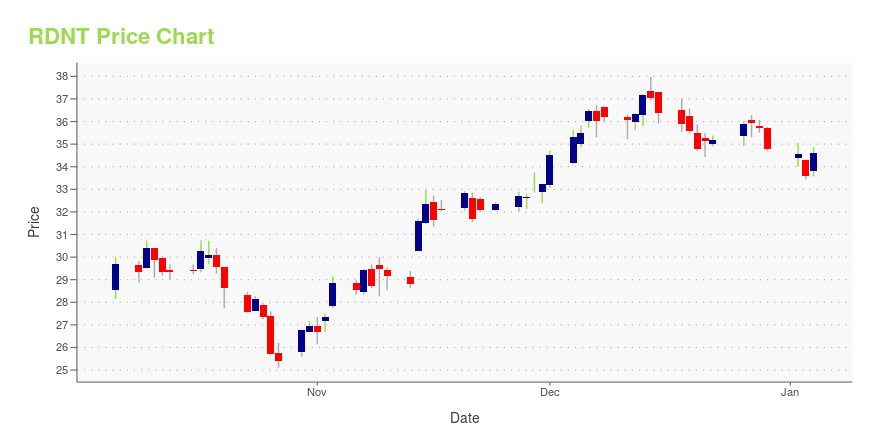
RDNT Stock Price Chart Interactive Chart >

RDNT POWR Grades

  • Sentiment is the dimension where RDNT ranks best; there it ranks ahead of 96.42% of US stocks.
  • RDNT's strongest trending metric is Stability; it's been moving down over the last 177 days.
  • RDNT ranks lowest in Momentum; there it ranks in the 14th percentile.

RDNT Stock Summary

  • With a one year PEG ratio of 389.8, RADNET INC is expected to have a higher PEG ratio (a measure of how expensive a stock is relative to its expected earnings growth) than 92.49% of US stocks.
  • Of note is the ratio of RADNET INC's sales and general administrative expense to its total operating expenses; just 0.26% of US stocks have a lower such ratio.
  • For RDNT, its debt to operating expenses ratio is greater than that reported by 93.92% of US equities we're observing.
  • Stocks with similar financial metrics, market capitalization, and price volatility to RADNET INC are NYC, GSL, MTN, HT, and AMPS.
  • Visit RDNT's SEC page to see the company's official filings. To visit the company's web site, go to www.radnet.com.

RDNT Valuation Summary

  • In comparison to the median Healthcare stock, RDNT's EV/EBIT ratio is 411.21% higher, now standing at 59.3.
  • RDNT's price/earnings ratio has moved down 143.2 over the prior 243 months.

Below are key valuation metrics over time for RDNT.

Stock Date P/S P/B P/E EV/EBIT
RDNT 2023-09-22 1.2 3.2 -145.0 59.3
RDNT 2023-09-21 1.2 3.1 -143.4 58.9
RDNT 2023-09-20 1.2 3.2 -147.4 59.9
RDNT 2023-09-19 1.2 3.2 -147.6 60.0
RDNT 2023-09-18 1.2 3.2 -147.2 59.9
RDNT 2023-09-15 1.3 3.3 -149.7 60.5

RDNT Growth Metrics

    Its 3 year revenue growth rate is now at 32.13%.
  • The 2 year revenue growth rate now stands at 15.23%.
  • Its 3 year price growth rate is now at 32.94%.
Over the past 67 months, RDNT's revenue has gone up $482,175,000.

The table below shows RDNT's growth in key financial areas (numbers in millions of US dollars).

Date Revenue Operating Cash Flow Net Income to Common Stock
2022-09-30 1,379.335 141.966 7.763
2022-06-30 1,361.981 156.534 23.315
2022-03-31 1,341.524 122.308 18.283
2021-12-31 1,315.077 149.491 24.727
2021-09-30 1,289.862 163.711 34.508
2021-06-30 1,248.948 160.995 24.444

RDNT's Quality Factors

The “Quality” component of the POWR Ratings focuses on 31 different factors of a companies fundamentals and operational strength. Here are some key insights as we drill into the specifics of these quality attributes.
  • RDNT has a Quality Grade of D, ranking ahead of 24.89% of graded US stocks.
  • RDNT's asset turnover comes in at 0.678 -- ranking 43rd of 81 Healthcare stocks.
  • SEM, CHE, and NTRA are the stocks whose asset turnover ratios are most correlated with RDNT.

The table below shows RDNT's key quality metrics over time.

Period Asset Turnover Gross Margin ROIC
2021-06-30 0.678 0.143 0.044
2021-03-31 0.627 0.113 0.035
2020-12-31 0.619 0.099 0.016
2020-09-30 0.628 0.095 0.016
2020-06-30 0.638 0.088 0.014
2020-03-31 0.710 0.120 0.026

RDNT Price Target

For more insight on analysts targets of RDNT, see our RDNT price target page. And for a list of of all stocks sorted by upside potential based on analyst target price, see our Top Price Target page.

Average Price Target $43.67 Average Broker Recommendation 1.38 (Strong Buy)

RadNet, Inc. (RDNT) Company Bio


RadNet, Inc. provides outpatient diagnostic imaging services in the United States. The company was founded in 1985 and is based in Los Angeles, California.


RDNT Latest News Stream


Event/Time News Detail
Loading, please wait...

RDNT Latest Social Stream


Loading social stream, please wait...

View Full RDNT Social Stream

Latest RDNT News From Around the Web

Below are the latest news stories about RADNET INC that investors may wish to consider to help them evaluate RDNT as an investment opportunity.

RadNet, Inc. to Present at the Sidoti & Company Fall 2023 Virtual Conference on Wednesday, September 20th

LOS ANGELES, Sept. 20, 2023 (GLOBE NEWSWIRE) -- RadNet, Inc. (NASDAQ: RDNT), a national leader in providing high-quality, cost-effective diagnostic imaging services through a network of fully-owned and operated outpatient imaging centers, today announced that Mark Stolper, Executive Vice President and Chief Financial Officer, will be presenting at the Sidoti & Company Fall 2023 Conference on Wednesday, September 20th at 4:00 p.m. Eastern Time. There will be simultaneous and archived webcasts ava

Yahoo | September 20, 2023

Sidoti Events, LLC’s Virtual September Small-Cap Conference

Sidoti Events, LLC, an affiliate of Sidoti & Company, LLC, has released the presentation schedule and weblinks for its two-day September Small-Cap Conference taking place Wednesday and Thursday, September 20-21, 2023. The presentation schedule is subject to change.

Yahoo | September 19, 2023

Zacks Industry Outlook Highlights DaVita, Encompass Health, Option Care Health and RadNet

DaVita, Encompass Health, Option Care Health and RadNet are part of the Zacks Industry Outlook article.

Yahoo | September 5, 2023

4 Stocks to Buy in a Booming Outpatient Home Health Industry

Despite the macroeconomic challenges, dependence on telehealth and AI dominance are likely to drive the Zacks Medical - Outpatient and Home Healthcare industry. DVA, EHC, OPCH and RDNT are well-poised to gain.

Yahoo | September 1, 2023

Be Wary Of RadNet (NASDAQ:RDNT) And Its Returns On Capital

What are the early trends we should look for to identify a stock that could multiply in value over the long term? In a...

Yahoo | August 31, 2023

Read More 'RDNT' Stories Here

RDNT Price Returns

1-mo -12.52%
3-mo -12.39%
6-mo 14.18%
1-year 37.14%
3-year 90.66%
5-year 89.90%
YTD 51.78%
2022 -37.46%
2021 53.86%
2020 -3.60%
2019 99.61%
2018 0.69%

Get Free Updates

Join thousands of investors who get the latest news, insights and top rated picks from StockNews.com!