
Dr. Reddy's Laboratories Ltd (RDY): Price and Financial Metrics
RDY Price/Volume Stats
| Current price | $15.33 | 52-week high | $16.89 |
| Prev. close | $15.50 | 52-week low | $12.26 |
| Day low | $15.31 | Volume | 1,511,328 |
| Day high | $15.56 | Avg. volume | 1,996,519 |
| 50-day MA | $14.52 | Dividend yield | 0.52% |
| 200-day MA | $14.49 | Market Cap | 12.80B |
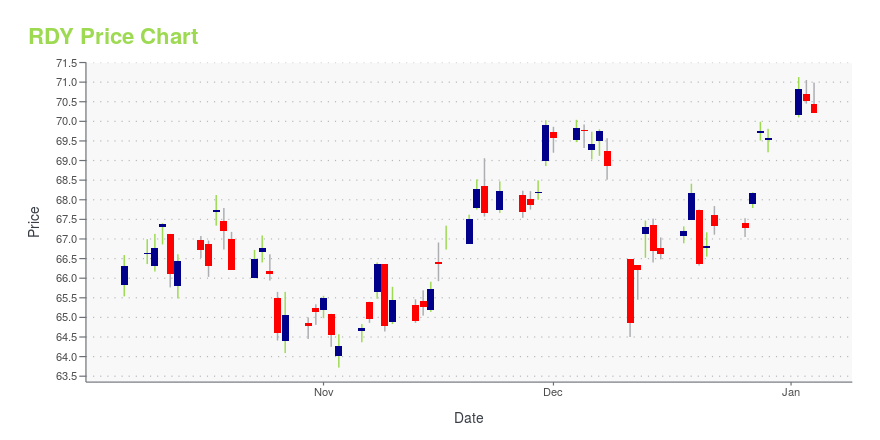
RDY Stock Price Chart Interactive Chart >
Dr. Reddy's Laboratories Ltd (RDY) Company Bio
Dr. Reddy's Laboratories operates as an integrated pharmaceutical company worldwide. It operates in three segments: Global Generics, Pharmaceutical Services and Active Ingredients (PSAI), and Proprietary Products. The company was founded in 1984 and is based in Hyderabad, India.
RDY Price Returns
| 1-mo | 3.93% |
| 3-mo | 16.14% |
| 6-mo | -3.34% |
| 1-year | 6.94% |
| 3-year | 41.88% |
| 5-year | 53.35% |
| YTD | -2.91% |
| 2024 | 14.03% |
| 2023 | 36.16% |
| 2022 | -19.92% |
| 2021 | -7.49% |
| 2020 | 76.61% |
RDY Dividends
| Ex-Dividend Date | Type | Payout Amount | Change | ||||||
|---|---|---|---|---|---|---|---|---|---|
| Loading, please wait... | |||||||||
Continue Researching RDY
Want to do more research on Dr Reddys Laboratories Ltd's stock and its price? Try the links below:Dr Reddys Laboratories Ltd (RDY) Stock Price | Nasdaq
Dr Reddys Laboratories Ltd (RDY) Stock Quote, History and News - Yahoo Finance
Dr Reddys Laboratories Ltd (RDY) Stock Price and Basic Information | MarketWatch
Loading social stream, please wait...