
Dr. Reddy's Laboratories Ltd (RDY): Price and Financial Metrics
RDY Price/Volume Stats
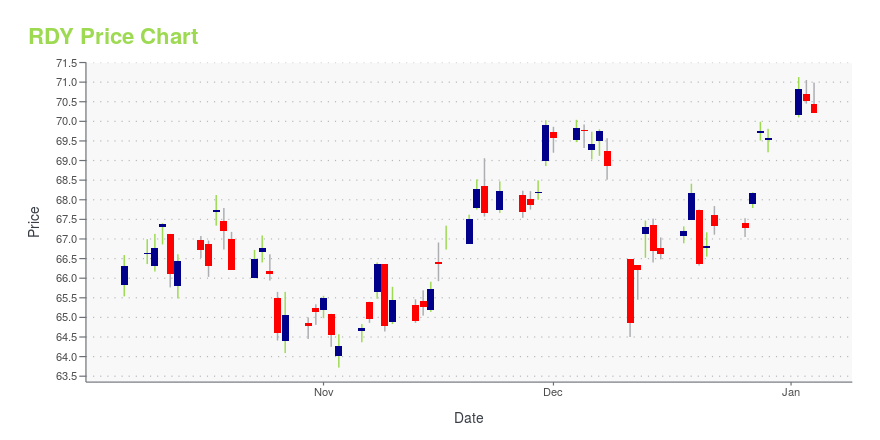
| Current price | $81.22 | 52-week high | $81.98 |
| Prev. close | $80.84 | 52-week low | $63.72 |
| Day low | $81.16 | Volume | 250,200 |
| Day high | $81.98 | Avg. volume | 226,174 |
| 50-day MA | $73.83 | Dividend yield | 0.51% |
| 200-day MA | $71.39 | Market Cap | 13.56B |
RDY Stock Price Chart Interactive Chart >
Dr. Reddy's Laboratories Ltd (RDY) Company Bio
Dr. Reddy's Laboratories operates as an integrated pharmaceutical company worldwide. It operates in three segments: Global Generics, Pharmaceutical Services and Active Ingredients (PSAI), and Proprietary Products. The company was founded in 1984 and is based in Hyderabad, India.
Latest RDY News From Around the Web
Below are the latest news stories about DR REDDYS LABORATORIES LTD that investors may wish to consider to help them evaluate RDY as an investment opportunity.
Dr. Reddy’s becomes first Indian pharma company to debut on the Dow Jones Sustainability World IndexHYDERABAD, India, December 14, 2023--Dr. Reddy’s has won back-to-back global recognitions for its commitment and progress on sustainability and Environment Social and Governance agenda. |
Coya Therapeutics, Inc. and Dr. Reddy’s Laboratories Enter into an Exclusive Collaboration for Development and Commercialization of COYA 302, an Investigational Combination Therapy for Treatment of Amyotrophic Lateral Sclerosis (ALS)HOUSTON & HYDERABAD, India & BASEL, Switzerland, December 06, 2023--Dr. Reddy's Laboratories SA, wholly-owned subsidiary of Dr. Reddy’s Laboratories Ltd. (BSE: 500124, NSE: DRREDDY, NYSE: RDY, NSEIFSC: DRREDDY, along with its subsidiaries together referred to as "Dr. Reddy’s"), and Coya Therapeutics, Inc. (NASDAQ: COYA) ("Coya"), today announced that they have entered into a development and license agreement (the "Agreement") for the development and commercialization of COYA 302, an investigatio |
Why Doctor Reddy's (RDY) is a Top Value Stock for the Long-TermWondering how to pick strong, market-beating stocks for your investment portfolio? Look no further than the Zacks Style Scores. |
Dr. Reddy's (RDY) Q2 Earnings and Revenues Beat EstimatesDr. Reddy's (RDY) reports better-than-expected fiscal second-quarter 2024 results where both earnings and revenues beat estimates, driven by growth in core businesses in North America and Europe. |
Dr. Reddy’s Laboratories Limited (NYSE:RDY) Q2 2024 Earnings Call TranscriptDr. Reddy’s Laboratories Limited (NYSE:RDY) Q2 2024 Earnings Call Transcript October 27, 2023 Dr. Reddy’s Laboratories Limited beats earnings expectations. Reported EPS is $1.07, expectations were $0.88. Operator: Ladies and gentlemen, good day, and welcome to the Dr. Reddy’s Q2 FY ’24 Earnings Conference Call. [Operator Instructions]. Please note that this conference is being recorded. […] |
RDY Price Returns
| 1-mo | 7.72% |
| 3-mo | 8.95% |
| 6-mo | 15.96% |
| 1-year | 18.04% |
| 3-year | 32.36% |
| 5-year | 123.25% |
| YTD | 16.73% |
| 2023 | 36.16% |
| 2022 | -19.92% |
| 2021 | -7.49% |
| 2020 | 76.61% |
| 2019 | 8.38% |
RDY Dividends
| Ex-Dividend Date | Type | Payout Amount | Change | ||||||
|---|---|---|---|---|---|---|---|---|---|
| Loading, please wait... | |||||||||
Continue Researching RDY
Want to do more research on Dr Reddys Laboratories Ltd's stock and its price? Try the links below:Dr Reddys Laboratories Ltd (RDY) Stock Price | Nasdaq
Dr Reddys Laboratories Ltd (RDY) Stock Quote, History and News - Yahoo Finance
Dr Reddys Laboratories Ltd (RDY) Stock Price and Basic Information | MarketWatch
Loading social stream, please wait...