
Ring Energy, Inc. (REI): Price and Financial Metrics
REI Price/Volume Stats
| Current price | $1.92 | 52-week high | $2.43 |
| Prev. close | $1.95 | 52-week low | $1.25 |
| Day low | $1.84 | Volume | 1,397,820 |
| Day high | $2.00 | Avg. volume | 1,805,434 |
| 50-day MA | $1.77 | Dividend yield | N/A |
| 200-day MA | $1.67 | Market Cap | 380.04M |
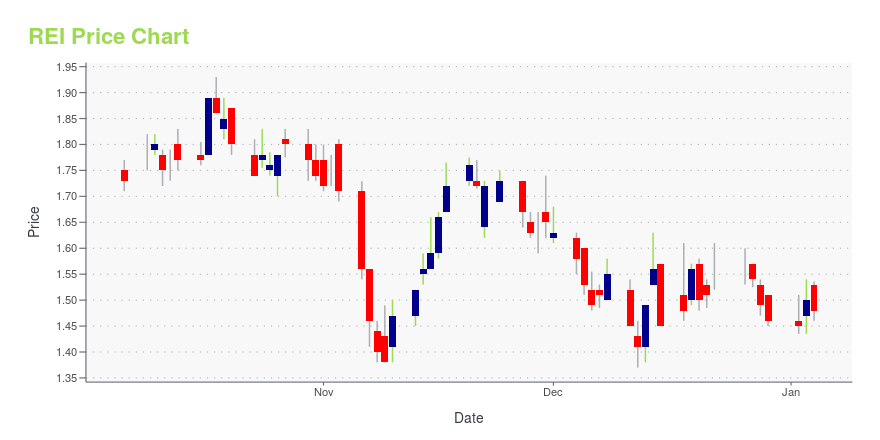
REI Stock Price Chart Interactive Chart >
Ring Energy, Inc. (REI) Company Bio
Ring Energy engages in the exploration, development, and production of oil and gas. The company was founded in 2004 and is based in Midlands, Texas.
Latest REI News From Around the Web
Below are the latest news stories about RING ENERGY INC that investors may wish to consider to help them evaluate REI as an investment opportunity.
Penny Stock Power Plays: 3 Pocket-Size Names With Huge PotentialPenny stocks can be a huge growth driver for your portfolio. |
Ring Energy Announces Issuance of 2023 Sustainability ReportTHE WOODLANDS, Texas, Dec. 28, 2023 (GLOBE NEWSWIRE) -- Ring Energy, Inc. (NYSE American: REI) (“Ring” or the “Company”) today announced that it has issued its 2023 Sustainability Report (the “2023 Report”), which is available on the Company’s website at www.ringenergy.com under the “Sustainability” tab. The report provides updated and comprehensive information about Ring’s Environmental, Social and Governance (“ESG”) initiatives and related key performance indicators. In the creation of the doc |
Ring Energy Announces Successful Results of Senior Credit Facility Fall 2023 Redetermination and Final Payment for Founders Property AcquisitionTHE WOODLANDS, Texas, Dec. 21, 2023 (GLOBE NEWSWIRE) -- Ring Energy, Inc. (NYSE American: REI) (“Ring” or the “Company”) today announced that the borrowing base was reaffirmed at $600 million under its $1.0 billion senior revolving credit facility (the “Credit Facility”). In addition, the Company announced that it had recently made the final payment of $11.9 million on its previously-announced acquisition of the Central Basin Platform assets of Founders Oil & Gas IV, LLC (“Founders”). The paymen |
11 Best Fundamentally Strong Penny Stocks To Invest InIn this article, we will take a detailed look at the 11 Best Fundamentally Strong Penny Stocks To Invest In. For a quick overview of such stocks, read our article 5 Best Fundamentally Strong Penny Stocks To Invest In. Investors spent most of 2023 looking over their shoulders for the next Fed decision and that next important CPI or […] |
Sidoti Events, LLC's Virtual December Small-Cap ConferenceNEW YORK, NY / ACCESSWIRE / December 5, 2023 / Sidoti Events, LLC, an affiliate of Sidoti & Company, LLC, has released the presentation schedule and weblinks for its two-day December Small-Cap Conference taking place Wednesday and Thursday, December ... |
REI Price Returns
| 1-mo | 20.00% |
| 3-mo | -4.00% |
| 6-mo | 38.13% |
| 1-year | -18.64% |
| 3-year | -23.51% |
| 5-year | -20.33% |
| YTD | 31.51% |
| 2023 | -40.65% |
| 2022 | 7.89% |
| 2021 | 245.51% |
| 2020 | -75.00% |
| 2019 | -48.03% |
Continue Researching REI
Here are a few links from around the web to help you further your research on Ring Energy Inc's stock as an investment opportunity:Ring Energy Inc (REI) Stock Price | Nasdaq
Ring Energy Inc (REI) Stock Quote, History and News - Yahoo Finance
Ring Energy Inc (REI) Stock Price and Basic Information | MarketWatch
Loading social stream, please wait...