RPC, Inc. (RES): Price and Financial Metrics
RES Price/Volume Stats
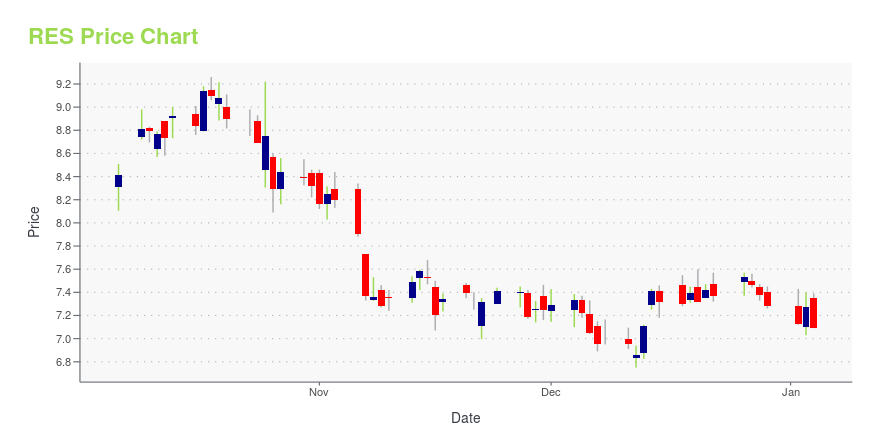
Current price | $7.55 | 52-week high | $9.41 |
Prev. close | $7.62 | 52-week low | $6.34 |
Day low | $7.51 | Volume | 1,426,000 |
Day high | $7.70 | Avg. volume | 1,742,509 |
50-day MA | $7.14 | Dividend yield | 2.14% |
200-day MA | $7.75 | Market Cap | 1.63B |
RES Stock Price Chart Interactive Chart >
RES POWR Grades
- RES scores best on the Value dimension, with a Value rank ahead of 86.47% of US stocks.
- RES's strongest trending metric is Growth; it's been moving down over the last 26 weeks.
- RES ranks lowest in Sentiment; there it ranks in the 1st percentile.
RES Stock Summary
- RPC INC's stock had its IPO on December 30, 1987, making it an older stock than 89.95% of US equities in our set.
- RES's current price/earnings ratio is 6.5, which is higher than only 8.48% of US stocks with positive earnings.
- Price to trailing twelve month operating cash flow for RES is currently 3.42, higher than only 11.56% of US stocks with positive operating cash flow.
- Stocks that are quantitatively similar to RES, based on their financial statements, market capitalization, and price volatility, are DWSN, KEX, JBLU, HAIN, and ALK.
- RES's SEC filings can be seen here. And to visit RPC INC's official web site, go to www.rpc.net.
RES Valuation Summary
- RES's price/earnings ratio is 6.6; this is 22.81% lower than that of the median Energy stock.
- RES's price/earnings ratio has moved down 42 over the prior 243 months.
Below are key valuation metrics over time for RES.
Stock | Date | P/S | P/B | P/E | EV/EBIT |
---|---|---|---|---|---|
RES | 2023-12-28 | 0.9 | 1.6 | 6.6 | 4.6 |
RES | 2023-12-27 | 0.9 | 1.6 | 6.7 | 4.6 |
RES | 2023-12-26 | 1.0 | 1.6 | 6.7 | 4.7 |
RES | 2023-12-22 | 0.9 | 1.6 | 6.6 | 4.6 |
RES | 2023-12-21 | 0.9 | 1.6 | 6.6 | 4.6 |
RES | 2023-12-20 | 0.9 | 1.6 | 6.5 | 4.5 |
RES Growth Metrics
- The 4 year net cashflow from operations growth rate now stands at 422.13%.
- Its 4 year cash and equivalents growth rate is now at -20.91%.
- The 2 year net income to common stockholders growth rate now stands at 112.95%.
The table below shows RES's growth in key financial areas (numbers in millions of US dollars).
Date | Revenue | Operating Cash Flow | Net Income to Common Stock |
---|---|---|---|
2022-09-30 | 1,387.984 | 62.231 | 143.697 |
2022-06-30 | 1,153.693 | 35.706 | 79.623 |
2022-03-31 | 966.943 | 46.703 | 31.958 |
2021-12-31 | 864.929 | 47.719 | 7.217 |
2021-09-30 | 745.314 | -26.99 | -15.361 |
2021-06-30 | 636.592 | 10.725 | -37.064 |
RES's Quality Factors
The “Quality” component of the POWR Ratings focuses on 31 different factors of a companies fundamentals and operational strength. Here are some key insights as we drill into the specifics of these quality attributes.- RES has a Quality Grade of C, ranking ahead of 57.26% of graded US stocks.
- RES's asset turnover comes in at 0.929 -- ranking 16th of 136 Petroleum and Natural Gas stocks.
- MPC, VNOM, and CLB are the stocks whose asset turnover ratios are most correlated with RES.
The table below shows RES's key quality metrics over time.
Period | Asset Turnover | Gross Margin | ROIC |
---|---|---|---|
2021-09-30 | 0.929 | 0.221 | -0.037 |
2021-06-30 | 0.800 | 0.198 | -0.105 |
2021-03-31 | 0.677 | 0.171 | -0.169 |
2020-12-31 | 0.738 | 0.196 | -0.507 |
2020-09-30 | 0.782 | 0.213 | -0.464 |
2020-06-30 | 0.904 | 0.230 | -0.489 |
RES Price Target
For more insight on analysts targets of RES, see our RES price target page. And for a list of of all stocks sorted by upside potential based on analyst target price, see our Top Price Target page.
Average Price Target | $4.99 | Average Broker Recommendation | 2.07 (Hold) |
RPC, Inc. (RES) Company Bio
RPC Inc. provides a broad range of specialized oilfield services and equipment primarily to independent and major oilfield companies engaged in the exploration, production and development of oil and gas properties throughout the United States, including the Gulf of Mexico, mid-continent, southwest, Appalachian and Rocky Mountain regions, and in selected international markets. The company was founded in 1984 and is based in Atlanta, Georgia.
Latest RES News From Around the Web
Below are the latest news stories about RPC INC that investors may wish to consider to help them evaluate RES as an investment opportunity.
SLB (SLB) Moves 6.6% Higher: Will This Strength Last?SLB (SLB) witnessed a jump in share price last session on above-average trading volume. The latest trend in earnings estimate revisions for the stock doesn't suggest further strength down the road. |
If EPS Growth Is Important To You, RPC (NYSE:RES) Presents An OpportunityInvestors are often guided by the idea of discovering 'the next big thing', even if that means buying 'story stocks... |
Why Is RPC (RES) Down 11.7% Since Last Earnings Report?RPC (RES) reported earnings 30 days ago. What's next for the stock? We take a look at earnings estimates for some clues. |
Investors in RPC (NYSE:RES) have seen impressive returns of 118% over the past three yearsRPC, Inc. ( NYSE:RES ) shareholders might be concerned after seeing the share price drop 18% in the last month. But... |
Be Sure To Check Out RPC, Inc. (NYSE:RES) Before It Goes Ex-DividendReaders hoping to buy RPC, Inc. ( NYSE:RES ) for its dividend will need to make their move shortly, as the stock is... |
RES Price Returns
1-mo | 3.14% |
3-mo | 3.73% |
6-mo | -12.25% |
1-year | -2.82% |
3-year | 48.02% |
5-year | -25.41% |
YTD | 4.30% |
2023 | -16.42% |
2022 | 96.73% |
2021 | 44.13% |
2020 | -39.89% |
2019 | -46.14% |
RES Dividends
Ex-Dividend Date | Type | Payout Amount | Change | ||||||
---|---|---|---|---|---|---|---|---|---|
Loading, please wait... |
Continue Researching RES
Here are a few links from around the web to help you further your research on Rpc Inc's stock as an investment opportunity:Rpc Inc (RES) Stock Price | Nasdaq
Rpc Inc (RES) Stock Quote, History and News - Yahoo Finance
Rpc Inc (RES) Stock Price and Basic Information | MarketWatch
Loading social stream, please wait...