Rex American Resources Corp. (REX): Price and Financial Metrics
REX Price/Volume Stats
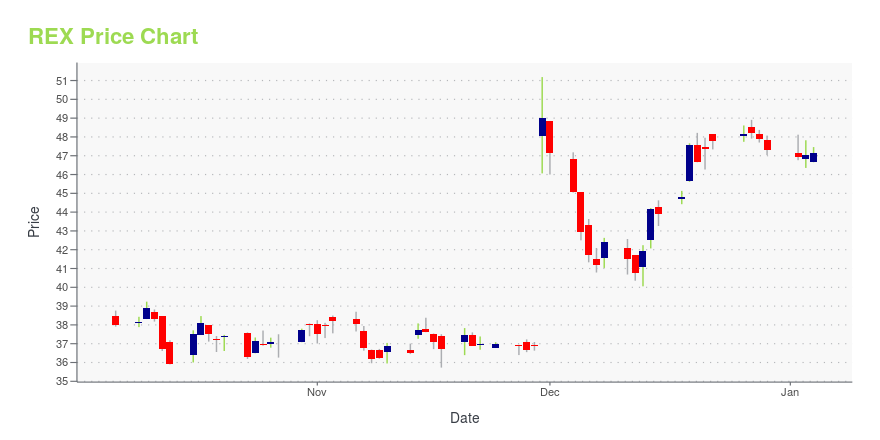
Current price | $44.89 | 52-week high | $51.19 |
Prev. close | $44.40 | 52-week low | $27.42 |
Day low | $44.35 | Volume | 123,800 |
Day high | $44.97 | Avg. volume | 112,408 |
50-day MA | $43.41 | Dividend yield | N/A |
200-day MA | $39.56 | Market Cap | 785.75M |
REX Stock Price Chart Interactive Chart >
REX POWR Grades
- REX scores best on the Sentiment dimension, with a Sentiment rank ahead of 96.99% of US stocks.
- The strongest trend for REX is in Value, which has been heading down over the past 26 weeks.
- REX's current lowest rank is in the Momentum metric (where it is better than 25.25% of US stocks).
REX Stock Summary
- REX AMERICAN RESOURCES CORP's stock had its IPO on January 1, 1986, making it an older stock than 92.92% of US equities in our set.
- Of note is the ratio of REX AMERICAN RESOURCES CORP's sales and general administrative expense to its total operating expenses; 87.34% of US stocks have a lower such ratio.
- REX's equity multiplier -- a measure of assets relative to shareholders'equity -- is greater than that of only 15.94% of US stocks.
- Stocks that are quantitatively similar to REX, based on their financial statements, market capitalization, and price volatility, are ESP, USLM, WHD, WORX, and VC.
- REX's SEC filings can be seen here. And to visit REX AMERICAN RESOURCES CORP's official web site, go to www.rexamerican.com.
REX Valuation Summary
- In comparison to the median Basic Materials stock, REX's EV/EBIT ratio is 13.43% lower, now standing at 11.6.
- Over the past 243 months, REX's EV/EBIT ratio has gone up 4.3.
Below are key valuation metrics over time for REX.
Stock | Date | P/S | P/B | P/E | EV/EBIT |
---|---|---|---|---|---|
REX | 2023-12-29 | 1 | 1.7 | 17.1 | 11.6 |
REX | 2023-12-28 | 1 | 1.7 | 17.3 | 11.8 |
REX | 2023-12-27 | 1 | 1.7 | 17.4 | 11.9 |
REX | 2023-12-26 | 1 | 1.7 | 17.4 | 11.8 |
REX | 2023-12-22 | 1 | 1.7 | 17.2 | 11.7 |
REX | 2023-12-21 | 1 | 1.7 | 17.1 | 11.6 |
REX Growth Metrics
- The 5 year net income to common stockholders growth rate now stands at -108.9%.
- Its 4 year net cashflow from operations growth rate is now at -89.78%.
- The year over year cash and equivalents growth rate now stands at -54.91%.
The table below shows REX's growth in key financial areas (numbers in millions of US dollars).
Date | Revenue | Operating Cash Flow | Net Income to Common Stock |
---|---|---|---|
2022-09-30 | 866.849 | 95.274 | 40.962 |
2022-06-30 | 849.638 | 75.325 | 53.056 |
2022-03-31 | 805.153 | 60.469 | 49.762 |
2021-12-31 | 774.802 | 91.711 | 52.364 |
2021-09-30 | 689.031 | 37.555 | 34.481 |
2021-06-30 | 610.216 | 34.814 | 28.044 |
REX's Quality Factors
The “Quality” component of the POWR Ratings focuses on 31 different factors of a companies fundamentals and operational strength. Here are some key insights as we drill into the specifics of these quality attributes.- REX has a Quality Grade of B, ranking ahead of 75.72% of graded US stocks.
- REX's asset turnover comes in at 1.254 -- ranking 6th of 89 Chemicals stocks.
- KRA, EMN, and OLN are the stocks whose asset turnover ratios are most correlated with REX.
The table below shows REX's key quality metrics over time.
Period | Asset Turnover | Gross Margin | ROIC |
---|---|---|---|
2021-07-31 | 1.254 | 0.088 | 0.087 |
2021-04-30 | 0.949 | 0.090 | 0.054 |
2021-01-31 | 0.784 | 0.037 | -0.013 |
2020-10-31 | 0.765 | 0.037 | -0.016 |
2020-07-31 | 0.680 | -0.018 | -0.076 |
2020-04-30 | 0.808 | -0.001 | -0.060 |
REX Price Target
For more insight on analysts targets of REX, see our REX price target page. And for a list of of all stocks sorted by upside potential based on analyst target price, see our Top Price Target page.
Average Price Target | $100.00 | Average Broker Recommendation | 1.5 (Moderate Buy) |
Rex American Resources Corp. (REX) Company Bio
REX American Resources Corp. is a holding company, which engages in the investment in alternative energy and ethanol production entities. It operates through the following segments: Ethanol and By-products and Refined Coal. The Ethanol and By-products segment refers to the equity investments in three ethanol limited liability companies. The Refined Coal segment includes the equity interest in one refined coal limited liability company. The company was founded in 1984 and is headquartered in Dayton, OH.
Latest REX News From Around the Web
Below are the latest news stories about REX AMERICAN RESOURCES CORP that investors may wish to consider to help them evaluate REX as an investment opportunity.
3 Top Efficient Stocks To Enrich Your Portfolio In 2024Regardless of market conditions, companies with favorable efficiency levels are more likely to be investors’ choice. |
REX American Resources Corporation (NYSE:REX) Q3 2023 Earnings Call TranscriptREX American Resources Corporation (NYSE:REX) Q3 2023 Earnings Call Transcript November 30, 2023 REX American Resources Corporation beats earnings expectations. Reported EPS is $1.49, expectations were $0.69. Operator: Greetings, and welcome to the REX American Resources Fiscal 2023 Third Quarter Conference Call. [Operator Instructions]. I would now like to turn the conference over to Mr. […] |
Here's Why REX American Resources (NYSE:REX) Has Caught The Eye Of InvestorsThe excitement of investing in a company that can reverse its fortunes is a big draw for some speculators, so even... |
REX American Resources Corp Reports Record Quarterly Net Income Per Share of $1.49REX Achieves Highest Quarterly Earnings Per Share in Its History |
REX American Resources Reports All Time Record Net Income Per Share Attributable to REX Common Shareholders of $1.49 for Its Fiscal 2023 Third QuarterDAYTON, Ohio, November 30, 2023--REX American Resources Corporation (NYSE: REX) ("REX" or "the Company") today reported financial results for its fiscal 2023 third quarter ("Q3 ‘23") ended October 31, 2023. REX management will host a conference call and webcast today at 11:00 a.m. ET. |
REX Price Returns
1-mo | 1.88% |
3-mo | -3.77% |
6-mo | 14.02% |
1-year | 47.47% |
3-year | 36.79% |
5-year | 60.51% |
YTD | -5.10% |
2023 | 48.46% |
2022 | -0.44% |
2021 | 30.67% |
2020 | -10.36% |
2019 | 20.33% |
Continue Researching REX
Want to do more research on REX AMERICAN RESOURCES Corp's stock and its price? Try the links below:REX AMERICAN RESOURCES Corp (REX) Stock Price | Nasdaq
REX AMERICAN RESOURCES Corp (REX) Stock Quote, History and News - Yahoo Finance
REX AMERICAN RESOURCES Corp (REX) Stock Price and Basic Information | MarketWatch
Loading social stream, please wait...