
Rexford Industrial Realty, Inc. (REXR): Price and Financial Metrics
REXR Price/Volume Stats
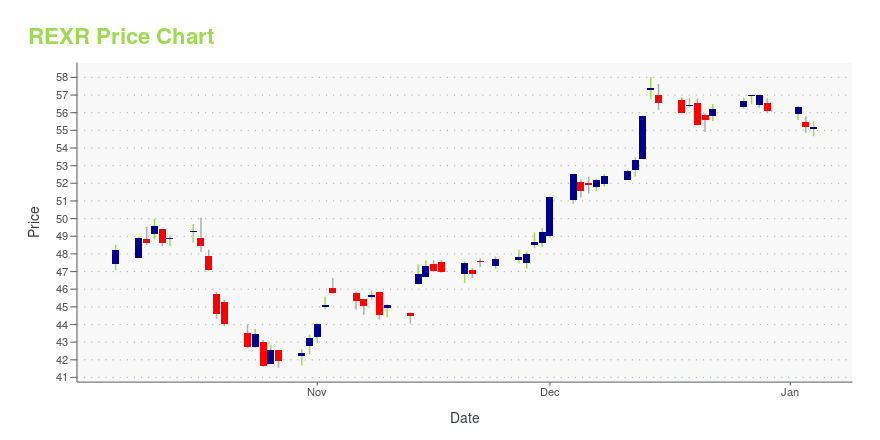
| Current price | $49.05 | 52-week high | $58.02 |
| Prev. close | $48.17 | 52-week low | $41.56 |
| Day low | $48.19 | Volume | 1,097,416 |
| Day high | $49.29 | Avg. volume | 1,776,180 |
| 50-day MA | $45.93 | Dividend yield | 3.38% |
| 200-day MA | $48.85 | Market Cap | 10.68B |
REXR Stock Price Chart Interactive Chart >
Rexford Industrial Realty, Inc. (REXR) Company Bio
Rexford Industrial Realty is a real estate investment trust focused on owning and operating industrial properties in Southern California infill markets. The company was founded in 2013 and is based in Los Angeles, California.
Latest REXR News From Around the Web
Below are the latest news stories about REXFORD INDUSTRIAL REALTY INC that investors may wish to consider to help them evaluate REXR as an investment opportunity.
Three REITs That Beat Estimates And Received Analyst UpgradesWithin the past two weeks, many real estate investment trusts (REITs) have defied lowered expectations from Wall Street by announcing third-quarter earnings that either met or exceeded the estimates or showed improvement from the third quarter of 2022. Share prices usually rise when companies report improved earnings, and if analyst upgrades follow, they often boost the price even further. Take a look at three REITs, from three different REIT sub-sectors that beat consensus estimates and have re |
Rexford Closes on $245M of SoCal Investments, Including Massive Brewing SiteRexford Industrial Realty has closed on two deals in Southern California worth a combined $245 million. The Los Angeles-based REIT acquired the fee simple interest in a fully leased property at 15801 West First Street, in Irwindale, Calif., for $120 million, or $121 per interior square foot. The deal was an off-market transaction from the seller, which records show was Pabst Brewing Company. |
10 Low Risk High Reward Stocks Set to Triple By 2027In this piece, we will take a look at the ten low risk high reward stocks set to triple by 2027. If you want to skip our introduction to stock trading indicators and the current market sentiment, then check out 5 Low Risk High Reward Stocks Set To Triple By 2027. Choosing the right stock, […] |
Rexford Industrial Announces $245 Million of Investment ActivityRexford Industrial Realty, Inc. (the "Company" or "Rexford Industrial") (NYSE: REXR), a real estate investment trust focused on creating value by investing in and operating industrial properties located throughout infill Southern California, today announced investment activity of $245.0 million that was funded using proceeds from forward equity settlements and cash on hand. |
Rexford Industrial Announces Science-Based Net-Zero Target ValidationRexford Industrial Realty, Inc. (the "Company" or "Rexford Industrial") (NYSE: REXR), a real estate investment trust focused on creating value by investing in and operating industrial properties located throughout infill Southern California, today announced the validation of its emissions reduction targets by the Science Based Targets initiative (SBTi), reaffirming the Company's commitment to creating value through a comprehensive ESGi approach. ESGi represents a holistic approach quantifying th |
REXR Price Returns
| 1-mo | 12.84% |
| 3-mo | 14.62% |
| 6-mo | -7.77% |
| 1-year | -7.63% |
| 3-year | -13.67% |
| 5-year | 31.71% |
| YTD | -10.98% |
| 2023 | 5.64% |
| 2022 | -31.17% |
| 2021 | 67.13% |
| 2020 | 9.69% |
| 2019 | 57.80% |
REXR Dividends
| Ex-Dividend Date | Type | Payout Amount | Change | ||||||
|---|---|---|---|---|---|---|---|---|---|
| Loading, please wait... | |||||||||
Continue Researching REXR
Want to do more research on Rexford Industrial Realty Inc's stock and its price? Try the links below:Rexford Industrial Realty Inc (REXR) Stock Price | Nasdaq
Rexford Industrial Realty Inc (REXR) Stock Quote, History and News - Yahoo Finance
Rexford Industrial Realty Inc (REXR) Stock Price and Basic Information | MarketWatch
Loading social stream, please wait...