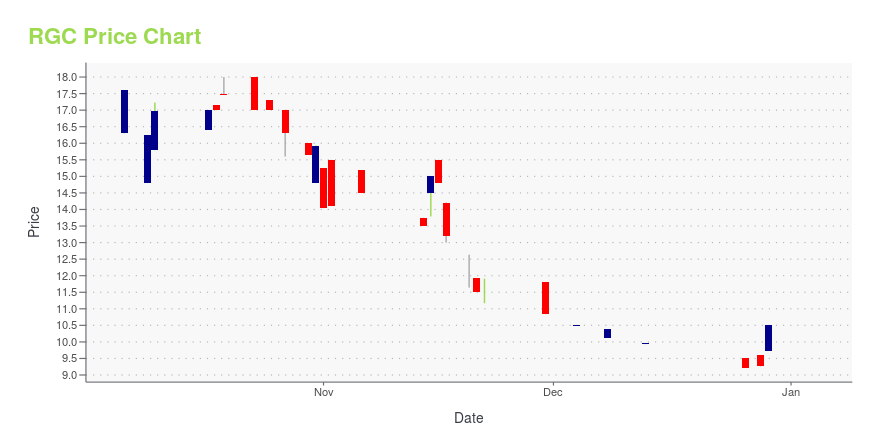
Regencell Bioscience Holdings Ltd. (RGC): Price and Financial Metrics
RGC Price/Volume Stats
| Current price | $12.29 | 52-week high | $32.44 |
| Prev. close | $9.11 | 52-week low | $3.03 |
| Day low | $10.60 | Volume | 2,364,230 |
| Day high | $19.10 | Avg. volume | 55,295 |
| 50-day MA | $5.20 | Dividend yield | N/A |
| 200-day MA | $10.59 | Market Cap | 159.93M |
RGC Stock Price Chart Interactive Chart >
Regencell Bioscience Holdings Ltd. (RGC) Company Bio
Regencell Bioscience Holdings Ltd. engages in the research, development, and commercialization of traditional Chinese medicine. It seeks for the treatment of neurocognitive disorders and degeneration, specifically attention deficit and hyperactivity disorder and autism spectrum disorder. The company was founded by Yat-Gai Au on October 30, 2014 and is headquartered in Hong Kong.
Latest RGC News From Around the Web
Below are the latest news stories about REGENCELL BIOSCIENCE HOLDINGS LTD that investors may wish to consider to help them evaluate RGC as an investment opportunity.
15 Developed Countries with Lowest Autism RatesIn this article, we will discuss 15 developed countries with lowest autism rates. If you want to skip our discussion on the autism industry, you can go directly to the 5 Developed Countries with Lowest Autism Rates. According to Fortune Business Insights, the autism spectrum disorder market was assessed at $1.93 billion in 2022. The […] |
Regencell Bioscience Holdings (NASDAQ:RGC) Is In A Good Position To Deliver On Growth PlansWe can readily understand why investors are attracted to unprofitable companies. For example, although... |
With 81% ownership, Regencell Bioscience Holdings Limited (NASDAQ:RGC) insiders have a lot riding on the company's futureKey Insights Regencell Bioscience Holdings' significant insider ownership suggests inherent interests in company's... |
One Regencell Bioscience Holdings Limited (NASDAQ:RGC) insider upped their stake by 0.5% in the previous yearLooking at Regencell Bioscience Holdings Limited's ( NASDAQ:RGC ) insider transactions over the last year, we can see... |
RGC Price Returns
| 1-mo | N/A |
| 3-mo | N/A |
| 6-mo | N/A |
| 1-year | N/A |
| 3-year | 36.56% |
| 5-year | N/A |
| YTD | 17.05% |
| 2023 | N/A |
| 2022 | 0.00% |
| 2021 | N/A |
| 2020 | N/A |
| 2019 | N/A |


Loading social stream, please wait...