
RGC Resources Inc. (RGCO): Price and Financial Metrics
RGCO Price/Volume Stats
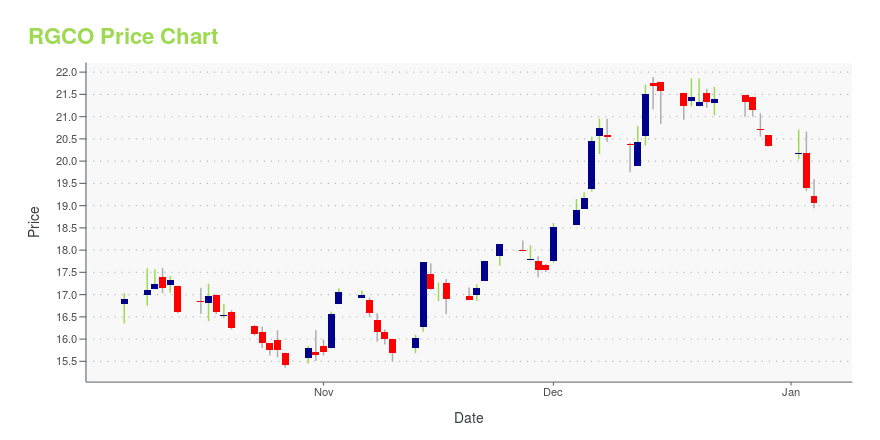
| Current price | $22.09 | 52-week high | $23.70 |
| Prev. close | $22.04 | 52-week low | $15.36 |
| Day low | $21.92 | Volume | 20,500 |
| Day high | $22.30 | Avg. volume | 15,749 |
| 50-day MA | $20.64 | Dividend yield | 3.49% |
| 200-day MA | $19.48 | Market Cap | 224.90M |
RGCO Stock Price Chart Interactive Chart >
RGC Resources Inc. (RGCO) Company Bio
RGC Resources, Inc. sells and distributes natural gas to residential, commercial, and industrial customers in Roanoke, Virginia, and the surrounding localities. The company was founded in 1912 and is based in Roanoke, Virginia.
Latest RGCO News From Around the Web
Below are the latest news stories about RGC RESOURCES INC that investors may wish to consider to help them evaluate RGCO as an investment opportunity.
New Strong Buy Stocks for December 8thRGCO, MOD, SAIC, BRSP and NINE have been added to the Zacks Rank #1 (Strong Buy) List on December 8, 2023. |
RGC Resources Inc. (RGCO) Upgraded to Strong Buy: What Does It Mean for the Stock?RGC Resources Inc. (RGCO) might move higher on growing optimism about its earnings prospects, which is reflected by its upgrade to a Zacks Rank #1 (Strong Buy). |
RGC Resources, Inc. (RGCO) Q4 2023 Earnings Call TranscriptRGC Resources, Inc. (RGCO) Q4 2023 Earnings Conference Call December 4, 2023 9:00 AM ET Company Participants Tommy Oliver - Senior Vice President of Regulatory and External Affairs Tim Mulvaney - Interim Chief Financial Officer and Treasurer Paul Nester - President and Chief Executive Officer Conference Call Participants Michael Gaugler - Janney Montgomery Scott Presentation Tommy Oliver Good morning. I am Tommy Oliver, Senior Vice President, Regulatory and External Affairs for RGC Resources, Inc. Thank you for joining us this morning as we discuss RGC Resources 2023 Quarter -- Fourth Quarter and Full-Year Results. I am joined this morning by Paul Nest... |
RGC Resources, Inc. Raises Annual Dividend to $0.80 per ShareROANOKE, Va., Nov. 28, 2023 (GLOBE NEWSWIRE) -- The Board of Directors of RGC Resources, Inc. (NASDAQ: RGCO), at its meeting on November 27, 2023, declared a quarterly dividend of $0.20 per share on the Company’s common stock. The indicated annual dividend is $0.80 per share, a $0.01 or 1.3% per share increase over the prior annual level. The Company has now increased the annual dividend 20 consecutive years. Paul Nester, CEO of RGC Resources, Inc., stated, “The Roanoke Gas utility continues to |
RGC Resources, Inc. Schedules Fourth Quarter 2023 Earnings CallROANOKE, Va., Nov. 22, 2023 (GLOBE NEWSWIRE) -- RGC Resources, Inc. (NASDAQ: RGCO) will host its quarterly conference call and webcast to review the results of its fiscal fourth quarter and 2023 fiscal year on Monday, December 4, 2023 at 9:00 a.m. eastern time. Related presentation materials will be available before the call on the Company website on the Investor & Financial Information page at https://www.rgcresources.com/investor-financial-information/. Interested parties may access the confer |
RGCO Price Returns
| 1-mo | 11.32% |
| 3-mo | 8.66% |
| 6-mo | 16.37% |
| 1-year | 12.09% |
| 3-year | -4.89% |
| 5-year | -10.27% |
| YTD | 10.71% |
| 2023 | -5.20% |
| 2022 | -0.59% |
| 2021 | -0.14% |
| 2020 | -14.46% |
| 2019 | -2.36% |
RGCO Dividends
| Ex-Dividend Date | Type | Payout Amount | Change | ||||||
|---|---|---|---|---|---|---|---|---|---|
| Loading, please wait... | |||||||||
Continue Researching RGCO
Want to do more research on Rgc Resources Inc's stock and its price? Try the links below:Rgc Resources Inc (RGCO) Stock Price | Nasdaq
Rgc Resources Inc (RGCO) Stock Quote, History and News - Yahoo Finance
Rgc Resources Inc (RGCO) Stock Price and Basic Information | MarketWatch
Loading social stream, please wait...