Repligen Corporation (RGEN): Price and Financial Metrics


Repligen Corporation (RGEN): $169.30

1.72 (+1.03%)

POWR Rating

Component Grades

Growth

S

Value

I

Momentum

G

Stability

N

Sentiment

U

Quality

P

Add RGEN to Watchlist
Sign Up

Industry: Biotech


Ranked

of

in industry

RGEN POWR Grades

  • Quality is the dimension where RGEN ranks best; there it ranks ahead of 53.25% of US stocks.
  • RGEN's strongest trending metric is Growth; it's been moving down over the last 177 days.
  • RGEN's current lowest rank is in the Momentum metric (where it is better than 10.23% of US stocks).

RGEN Stock Summary

  • With a price/earnings ratio of 47.88, REPLIGEN CORP P/E ratio is greater than that of about 88.12% of stocks in our set with positive earnings.
  • Price to trailing twelve month operating cash flow for RGEN is currently 51.74, higher than 92.15% of US stocks with positive operating cash flow.
  • RGEN's price/sales ratio is 11.11; that's higher than the P/S ratio of 90.66% of US stocks.
  • If you're looking for stocks that are quantitatively similar to REPLIGEN CORP, a group of peers worth examining would be TECH, STAA, OSIS, APPS, and PLAB.
  • RGEN's SEC filings can be seen here. And to visit REPLIGEN CORP's official web site, go to www.repligen.com.

RGEN Valuation Summary

  • RGEN's price/sales ratio is 11.1; this is 484.21% higher than that of the median Healthcare stock.
  • RGEN's price/sales ratio has moved down 12 over the prior 243 months.

Below are key valuation metrics over time for RGEN.

Stock Date P/S P/B P/E EV/EBIT
RGEN 2023-03-24 11.1 4.7 47.9 40.0
RGEN 2023-03-23 11.3 4.7 48.6 40.6
RGEN 2023-03-22 11.5 4.8 49.7 41.5
RGEN 2023-03-21 12.1 5.1 52.0 43.4
RGEN 2023-03-20 11.9 5.0 51.5 43.0
RGEN 2023-03-17 11.8 4.9 50.9 42.5

RGEN Growth Metrics

    The 5 year net income to common stockholders growth rate now stands at 76.56%.
  • Its 4 year net income to common stockholders growth rate is now at 76.56%.
  • The 3 year cash and equivalents growth rate now stands at 198.08%.
RGEN's revenue has moved up $617,834,000 over the prior 52 months.

The table below shows RGEN's growth in key financial areas (numbers in millions of US dollars).

Date Revenue Operating Cash Flow Net Income to Common Stock
2022-12-31 801.536 172.083 185.959
2022-09-30 801.295 159.821 166.34
2022-06-30 778.77 140.937 159.433
2022-03-31 734.097 132.867 145.805
2021-12-31 670.534 119.016 128.291
2021-09-30 592.661 84.267 118.879

RGEN's Quality Factors

The “Quality” component of the POWR Ratings focuses on 31 different factors of a companies fundamentals and operational strength. Here are some key insights as we drill into the specifics of these quality attributes.
  • RGEN has a Quality Grade of C, ranking ahead of 39.46% of graded US stocks.
  • RGEN's asset turnover comes in at 0.293 -- ranking 157th of 682 Pharmaceutical Products stocks.
  • ORMP, MESO, and AWH are the stocks whose asset turnover ratios are most correlated with RGEN.

The table below shows RGEN's key quality metrics over time.

Period Asset Turnover Gross Margin ROIC
2021-09-30 0.293 0.586 0.452
2021-06-30 0.278 0.588 0.369
2021-03-31 0.257 0.574 0.269
2020-12-31 0.235 0.572 0.186
2020-09-30 0.229 0.576 0.144
2020-06-30 0.215 0.569 0.109

RGEN Price Target

For more insight on analysts targets of RGEN, see our RGEN price target page. And for a list of of all stocks sorted by upside potential based on analyst target price, see our Top Price Target page.

Average Price Target $267.88 Average Broker Recommendation 1.35 (Strong Buy)

RGEN Stock Price Chart Interactive Chart >

Price chart for RGEN

RGEN Price/Volume Stats
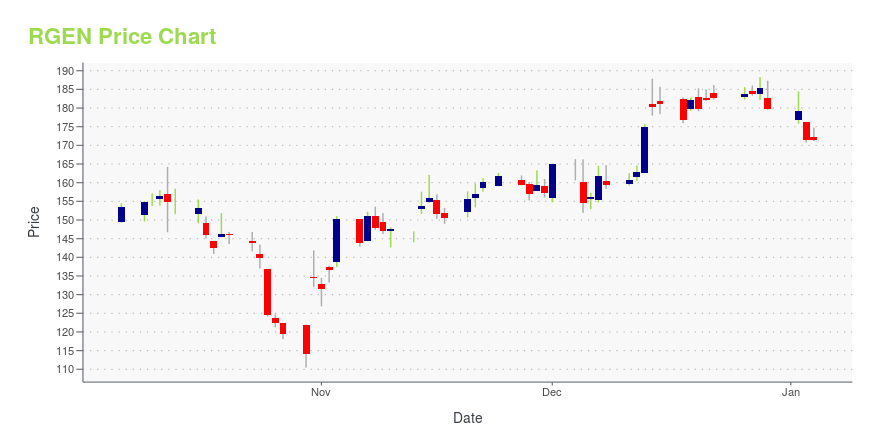
Current price $169.30 52-week high $262.26
Prev. close $167.58 52-week low $137.21
Day low $167.79 Volume 297,700
Day high $171.79 Avg. volume 569,007
50-day MA $180.67 Dividend yield N/A
200-day MA $188.22 Market Cap 9.42B

Repligen Corporation (RGEN) Company Bio


Repligen Corporation develops, manufactures, and markets consumable bioprocessing products for use in the production of monoclonal antibodies and other biologic drugs. The company was founded in 1981 and is based in Waltham, Massachusetts.


RGEN Latest News Stream


Event/Time News Detail
Loading, please wait...

RGEN Latest Social Stream


Loading social stream, please wait...

View Full RGEN Social Stream

Latest RGEN News From Around the Web

Below are the latest news stories about REPLIGEN CORP that investors may wish to consider to help them evaluate RGEN as an investment opportunity.

Why Is Repligen (RGEN) Down 11.4% Since Last Earnings Report?

Repligen (RGEN) reported earnings 30 days ago. What's next for the stock? We take a look at earnings estimates for some clues.

Yahoo | March 24, 2023

Repligen Corporation to Present at KeyBanc Life Science and MedTech Investor Forum

WALTHAM, Mass., March 14, 2023 (GLOBE NEWSWIRE) -- Repligen Corporation (NASDAQ:RGEN), a life sciences company focused on bioprocessing technology leadership, today announced that it will present virtually at the KeyBanc Life Science and MedTech Investor Forum being held March 21-22. Tony J. Hunt, President and Chief Executive Officer, will participate in an analyst-led discussion on Tuesday, March 21, at 1:30 p.m. EDT. A live webcast of the presentation will be accessible through the Investor R

Yahoo | March 14, 2023

Repligen Corporation (NASDAQ:RGEN) Q4 2022 Earnings Call Transcript

Repligen Corporation (NASDAQ:RGEN) Q4 2022 Earnings Call Transcript February 22, 2023 Operator: Good day, ladies and gentlemen, and welcome to the Repligen Corporation’s Fourth Quarter of 2022 Earnings Conference Call. My name is Chuck, and I will be your coordinator. All participants will be in a listen-only mode. . Please note that there will be […]

Yahoo | February 23, 2023

Repligen's (RGEN) Q4 Earnings and Revenues Beat Estimates

Repligen (RGEN) reports encouraging fourth-quarter and full-year 2022 results, with sales and earnings beating estimates.

Yahoo | February 23, 2023

Repligen Full Year 2022 Earnings: EPS Beats Expectations

Repligen ( NASDAQ:RGEN ) Full Year 2022 Results Key Financial Results Revenue: US$801.5m (up 20% from FY 2021). Net...

Yahoo | February 23, 2023

Read More 'RGEN' Stories Here

RGEN Price Returns

1-mo -2.91%
3-mo -0.01%
6-mo -9.52%
1-year -10.21%
3-year 76.69%
5-year 367.94%
YTD -0.01%
2022 -36.07%
2021 38.20%
2020 107.17%
2019 75.39%
2018 45.37%

Continue Researching RGEN

Want to see what other sources are saying about Repligen Corp's financials and stock price? Try the links below:

Repligen Corp (RGEN) Stock Price | Nasdaq
Repligen Corp (RGEN) Stock Quote, History and News - Yahoo Finance
Repligen Corp (RGEN) Stock Price and Basic Information | MarketWatch

Get Free Updates

Join thousands of investors who get the latest news, insights and top rated picks from StockNews.com!


Page generated in 0.7983 seconds.