
Riot Blockchain Inc. (RIOT): Price and Financial Metrics
RIOT Price/Volume Stats
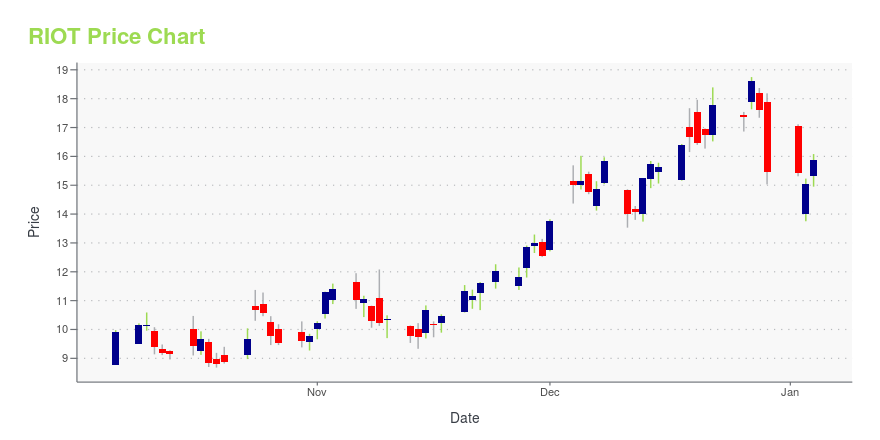
| Current price | $11.20 | 52-week high | $19.20 |
| Prev. close | $10.73 | 52-week low | $7.80 |
| Day low | $10.99 | Volume | 20,906,600 |
| Day high | $11.74 | Avg. volume | 25,002,990 |
| 50-day MA | $10.27 | Dividend yield | N/A |
| 200-day MA | $11.68 | Market Cap | 3.23B |
RIOT Stock Price Chart Interactive Chart >
Riot Blockchain Inc. (RIOT) Company Bio
Riot Blockchain, Inc. engages in the provision of investment services to the blockchain ecosystem as well as manufacturing in-vitro substances. Its portfolio includes Verady, Coinsquare, and Tesspay. The company was founded on July 24, 2000 and is headquartered in Castle Rock, CO.
Latest RIOT News From Around the Web
Below are the latest news stories about RIOT PLATFORMS INC that investors may wish to consider to help them evaluate RIOT as an investment opportunity.
3 Stocks That Are Better Bets Than Cryptos In 2024Cryptocurrency made a major comeback in 2023. The strong year-to-date rally in the most popular cryptocurrencies testifies to the crypto boom. However, given the volatility of this market, here is a look at stocks that may be better and safer bets. |
7 Cutting-Edge Tech Stocks That Will Define 2024After the massive gains artificial intelligence companies saw in 2023, there are additional gains to realize by investing in AI in 2024. |
Crypto-EquitiesIt’s more likely that BTC ease back over the coming months before making another thrust higher. |
Bitcoin mining stocks tumble after double-digital gainsShares of bitcoin (BTC-USD) mining operators, including Riot Blockchain (RIOT) and Marathon Digital Holdings (MARA), have moved into the red Thursday morning. The stocks have reversed course following major gains amid pending approval for a spot bitcoin ETF by the Securities and Exchange Commission (SEC). Yahoo Finance Crypto Reporter David Hollerith takes a look at Riot's and Marathon's plans to expand its crypto mining operations in 2024 and Cathie Wood's recent sale of ARK Invest's remaining Grayscale (GBTC) shares. For more expert insight and the latest market action, click here to watch this full episode of Yahoo Finance Live. |
Bitcoin miners expand operations on pending spot bitcoin ETFShares of crypto mining operators Riot Blockchain (RIOT) and Marathon Digital Holdings (MARA) are popping off on the prospects of Securities and Exchange Commission (SEC) regulators approving a spot bitcoin ETF (BTC-USD). Yahoo Finance Reporter Madison Mills joins the Live show to discuss bitcoin miners' plans to expand operations on this pending news and how their stocks have exponentially outperformed bitcoin and other digital asset companies in 2023. For more expert insight and the latest market action, click here to watch this full episode of Yahoo Finance Live. |
RIOT Price Returns
| 1-mo | 22.81% |
| 3-mo | -6.12% |
| 6-mo | -3.03% |
| 1-year | -39.06% |
| 3-year | -66.02% |
| 5-year | 477.32% |
| YTD | -27.60% |
| 2023 | 356.34% |
| 2022 | -84.82% |
| 2021 | 31.43% |
| 2020 | 1,416.96% |
| 2019 | -25.83% |
Continue Researching RIOT
Want to do more research on Riot Blockchain Inc's stock and its price? Try the links below:Riot Blockchain Inc (RIOT) Stock Price | Nasdaq
Riot Blockchain Inc (RIOT) Stock Quote, History and News - Yahoo Finance
Riot Blockchain Inc (RIOT) Stock Price and Basic Information | MarketWatch
Loading social stream, please wait...