Raymond James Financial, Inc. (RJF): Price and Financial Metrics
GET POWR RATINGS... FREE!
RJF POWR Grades
- Momentum is the dimension where RJF ranks best; there it ranks ahead of 72.46% of US stocks.
- The strongest trend for RJF is in Stability, which has been heading down over the past 179 days.
- RJF ranks lowest in Value; there it ranks in the 44th percentile.
RJF Stock Summary
- RJF has a higher market value than 88.97% of US stocks; more precisely, its current market capitalization is $23,402,978,307.
- RJF's went public 34.27 years ago, making it older than 89.7% of listed US stocks we're tracking.
- RJF's equity multiplier -- a measure of assets relative to shareholders'equity -- is greater than that of 86.04% of US stocks.
- Stocks that are quantitatively similar to RJF, based on their financial statements, market capitalization, and price volatility, are CINF, POOL, ULTA, PFG, and TSCO.
- Visit RJF's SEC page to see the company's official filings. To visit the company's web site, go to www.raymondjames.com.
RJF Valuation Summary
- In comparison to the median Financial Services stock, RJF's EV/EBIT ratio is 23.26% higher, now standing at 10.6.
- Over the past 243 months, RJF's price/sales ratio has gone up 1.2.
- RJF's price/earnings ratio has moved up 4.1 over the prior 243 months.
Below are key valuation metrics over time for RJF.
Stock | Date | P/S | P/B | P/E | EV/EBIT |
---|---|---|---|---|---|
RJF | 2019-10-10 | 1.4 | 1.7 | 10.5 | 5.7 |
RJF | 2015-04-23 | 1.7 | 1.9 | 16.8 | 10.0 |
RJF | 2014-06-16 | 1.5 | 1.8 | 16.2 | 9.3 |
RJF | 2009-04-29 | 0.7 | 1.0 | 8.1 | 4.5 |
RJF | 2006-08-22 | 1.4 | 2.3 | 16.0 | 2.2 |
RJF | 2005-04-05 | 1.2 | 2.0 | 15.7 | -3.6 |
RJF Growth Metrics
- Its 2 year net income to common stockholders growth rate is now at 30.11%.
- The 3 year net income to common stockholders growth rate now stands at 103.21%.
- Its 4 year net cashflow from operations growth rate is now at 676.67%.

The table below shows RJF's growth in key financial areas (numbers in millions of US dollars).
Date | Revenue | Operating Cash Flow | Net Income to Common Stock |
---|---|---|---|
2021-12-31 | 10,319 | 2,434 | 1,537 |
2021-09-30 | 9,760 | 6,625 | 1,403 |
2021-06-30 | 9,144 | 3,523 | 1,183 |
2021-03-31 | 8,507 | 1,827 | 1,048 |
2020-12-31 | 8,203 | 5,412 | 862 |
2020-09-30 | 7,990 | 4,054 | 818 |
RJF's Quality Factors
The “Quality” component of the POWR Ratings focuses on 31 different factors of a companies fundamentals and operational strength. Here are some key insights as we drill into the specifics of these quality attributes.- RJF has a Quality Grade of C, ranking ahead of 63.57% of graded US stocks.
- RJF's asset turnover comes in at 0.171 -- ranking 103rd of 442 Trading stocks.
- RLJ, FRT, and SPG are the stocks whose asset turnover ratios are most correlated with RJF.
The table below shows RJF's key quality metrics over time.
Period | Asset Turnover | Gross Margin | ROIC |
---|---|---|---|
2021-06-30 | 0.171 | 0.987 | 0.030 |
2021-03-31 | 0.169 | 0.987 | 0.029 |
2020-12-31 | 0.168 | 0.987 | 0.026 |
2020-09-30 | 0.175 | 0.987 | 0.028 |
2020-06-30 | 0.183 | 0.988 | 0.031 |
2020-03-31 | 0.192 | 0.988 | 0.036 |
RJF Price Target
For more insight on analysts targets of RJF, see our RJF price target page. And for a list of of all stocks sorted by upside potential based on analyst target price, see our Top Price Target page.
Average Price Target | $160.13 | Average Broker Recommendation | 1.4 (Strong Buy) |
RJF Stock Price Chart Interactive Chart >
RJF Price/Volume Stats
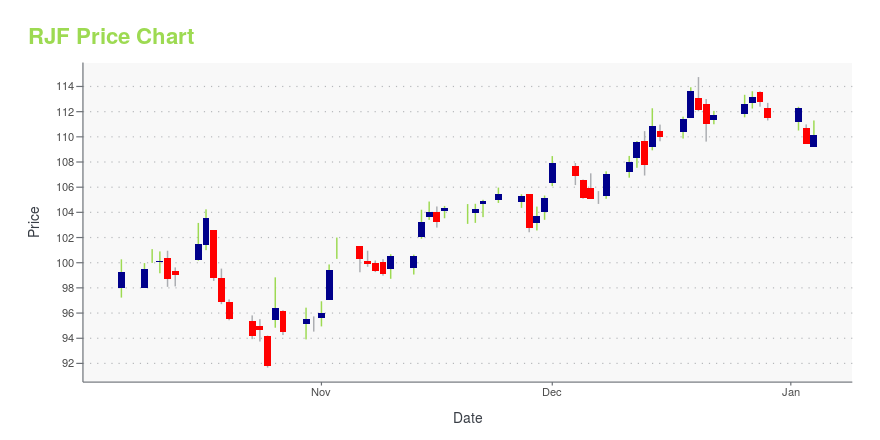
Current price | $92.94 | 52-week high | $117.37 |
Prev. close | $94.19 | 52-week low | $81.96 |
Day low | $90.79 | Volume | 791,064 |
Day high | $93.38 | Avg. volume | 1,299,309 |
50-day MA | $103.17 | Dividend yield | 1.44% |
200-day MA | $100.22 | Market Cap | 19.35B |
Raymond James Financial, Inc. (RJF) Company Bio
Raymond James Financial engages in the underwriting, distribution, trading, and brokerage of equity and debt securities, as well as the sale of mutual funds and other investment products in the United States, Canada, and Europe. The company was founded in 1962 and is based in St. Petersburg, Florida.
Latest RJF News From Around the Web
Below are the latest news stories about Raymond James Financial Inc that investors may wish to consider to help them evaluate RJF as an investment opportunity.
Raymond James Financial Declares Quarterly DividendST. PETERSBURG, Fla., Feb. 25, 2022 (GLOBE NEWSWIRE) -- On February 25, 2022, the Raymond James Financial, Inc. (NYSE: RJF) Board of Directors declared a quarterly cash dividend on shares of its common stock of $0.34 per share, payable April 18, 2022 to shareholders of record on April 4, 2022. About Raymond James Financial, Inc. Raymond James Financial, Inc. (NYSE: RJF) is a leading diversified financial services company providing private client group, capital markets, asset management, banking |
Raymond James private wealth adviser weighs in on SEC's proposed private investor rulesThe U.S. Securities and Exchange Commission's recently proposed rules for private investment funds are another signal that the agency is ramping up its regulatory agenda. |
Raymond James Financial, Inc. (RJF) Up 6.2% Since Last Earnings Report: Can It Continue?Raymond James Financial, Inc. (RJF) reported earnings 30 days ago. What's next for the stock? We take a look at earnings estimates for some clues. |
Meet Erin Linehan, a 2022 BusinessWoman of the Year honoreeErin Linehan is the chief compliance officer, global functions compliance and associate general counsel for Raymond James Financial, one of the largest public companies in Tampa Bay. |
Raymond James Financial Reports January 2022 Operating DataST. PETERSBURG, Fla., Feb. 23, 2022 (GLOBE NEWSWIRE) -- Raymond James Financial, Inc. (NYSE: RJF) today reported selected operating data for January 2022, in an effort to provide timely information to investors about monthly developments in certain key performance metrics. Due to the limited nature of this data, a consistent correlation to earnings should not be assumed. “Financial advisor retention and recruiting drove strong growth of client assets year-over-year,” said Chairman and CEO Paul R |
RJF Price Returns
1-mo | -10.22% |
3-mo | -12.79% |
6-mo | N/A |
1-year | 4.91% |
3-year | 68.46% |
5-year | 103.97% |
YTD | -6.83% |
2021 | 59.48% |
2020 | 8.70% |
2019 | 22.80% |
2018 | -15.65% |
2017 | 29.99% |
RJF Dividends
Ex-Dividend Date | Type | Payout Amount | Change | ||||||
---|---|---|---|---|---|---|---|---|---|
Loading, please wait... |
Continue Researching RJF
Here are a few links from around the web to help you further your research on Raymond James Financial Inc's stock as an investment opportunity:Raymond James Financial Inc (RJF) Stock Price | Nasdaq
Raymond James Financial Inc (RJF) Stock Quote, History and News - Yahoo Finance
Raymond James Financial Inc (RJF) Stock Price and Basic Information | MarketWatch
Loading social stream, please wait...