
Ralph Lauren Corp. CI A (RL): Price and Financial Metrics
RL Price/Volume Stats
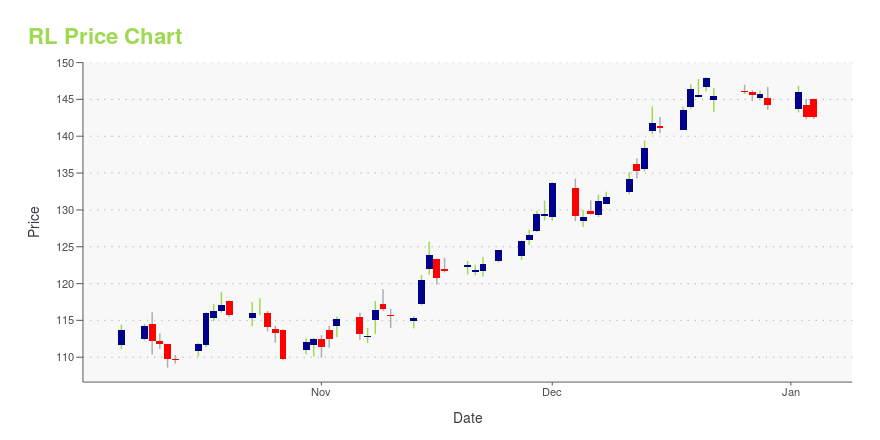
| Current price | $168.10 | 52-week high | $192.03 |
| Prev. close | $161.14 | 52-week low | $108.60 |
| Day low | $162.66 | Volume | 554,928 |
| Day high | $169.58 | Avg. volume | 948,332 |
| 50-day MA | $176.08 | Dividend yield | 1.98% |
| 200-day MA | $156.74 | Market Cap | 10.51B |
RL Stock Price Chart Interactive Chart >
Ralph Lauren Corp. CI A (RL) Company Bio
Ralph Lauren Corporation is an American publicly traded fashion company that was founded in 1967 by American fashion designer Ralph Lauren. The company is headquartered in New York City, and it produces products ranging from the mid-range to the luxury segments. They are known for the marketing and distribution of products in four categories: apparel, home, accessories, and fragrances. The company's brands include the mid-range Chaps brand, to the sub-premium Lauren Ralph Lauren brand, to the premium Polo Ralph Lauren, Double RL, Ralph Lauren Childrenswear, and Denim & Supply Ralph Lauren brands, up to the full luxury Ralph Lauren Purple Label and Ralph Lauren Collection brands. Ralph Lauren licenses its name and branding to Luxottica for eyewear; L'Oréal for fragrances and cosmetics; Hanesbrands for underwear and sleepwear; Kohl's and Hollander Sleep Products for bedding; Designers Guild for fabric and wallpaper; and EJ Victor for home furniture. (Source:Wikipedia)
Latest RL News From Around the Web
Below are the latest news stories about RALPH LAUREN CORP that investors may wish to consider to help them evaluate RL as an investment opportunity.
3 Top Textile Stocks to Weave Into Your 2024 PortfolioThese three popular textile and apparel stocks are poised to offer growth and a holiday boost to your long-term portfolio. |
Ralph Lauren Renews Flagship Store Lease While Reducing Office Footprint in ManhattanRalph Lauren is reconfiguring its footing on the Upper East Side. The company will keep its lavish Madison Avenue flagship store while cutting its office just a few blocks south by nearly 40 percent. The fashion brand signed a 10-year renewal for its 28,000-square-foot store inside the Rhinelander Mansion at 867 Madison Avenue, between East 71st and 72nd streets, Women’s Wear Daily reported. |
Here's Why Skechers (SKX) Stock Has Rallied 50.6% in a YearSkechers (SKX) is gaining on solid direct-to-consumer sales and comfort technology footwear. Its international business also appears encouraging. |
Steven Madden's (SHOO) Robust Growth Strategies Progress WellSteven Madden's (SHOO) e-commerce business appears encouraging. The company has ramped up digital marketing spending and rolled out buy online and pick up in store across its outlets. |
Ralph Lauren Corporation (NYSE:RL) Passed Our Checks, And It's About To Pay A US$0.75 DividendRegular readers will know that we love our dividends at Simply Wall St, which is why it's exciting to see Ralph Lauren... |
RL Price Returns
| 1-mo | -6.09% |
| 3-mo | 1.45% |
| 6-mo | 17.69% |
| 1-year | 35.67% |
| 3-year | 64.54% |
| 5-year | 69.43% |
| YTD | 17.61% |
| 2023 | 39.82% |
| 2022 | -8.41% |
| 2021 | 16.66% |
| 2020 | -10.63% |
| 2019 | 16.07% |
RL Dividends
| Ex-Dividend Date | Type | Payout Amount | Change | ||||||
|---|---|---|---|---|---|---|---|---|---|
| Loading, please wait... | |||||||||
Continue Researching RL
Want to do more research on Ralph Lauren Corp's stock and its price? Try the links below:Ralph Lauren Corp (RL) Stock Price | Nasdaq
Ralph Lauren Corp (RL) Stock Quote, History and News - Yahoo Finance
Ralph Lauren Corp (RL) Stock Price and Basic Information | MarketWatch
Loading social stream, please wait...