RLI Corp. (RLI): Price and Financial Metrics
RLI Price/Volume Stats
Current price | $123.85 | 52-week high | $149.65 |
Prev. close | $126.44 | 52-week low | $100.96 |
Day low | $123.82 | Volume | 273,434 |
Day high | $127.21 | Avg. volume | 218,578 |
50-day MA | $133.54 | Dividend yield | 0.82% |
200-day MA | $126.66 | Market Cap | 5.64B |
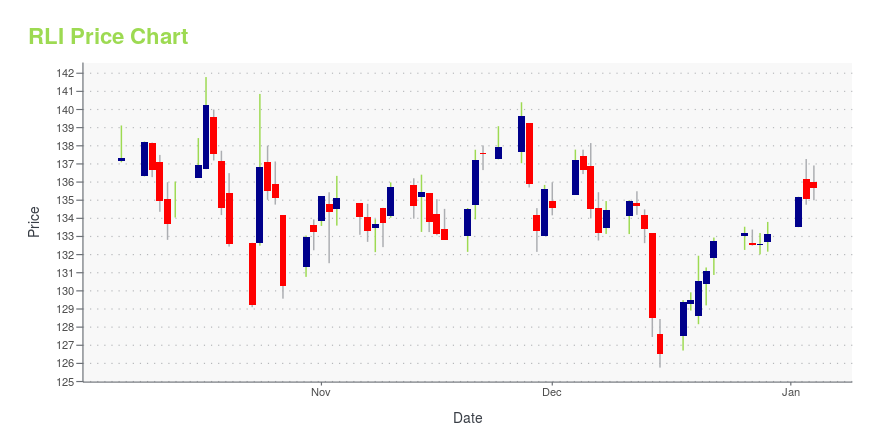
RLI Stock Price Chart Interactive Chart >
RLI POWR Grades
- RLI scores best on the Growth dimension, with a Growth rank ahead of 95.56% of US stocks.
- RLI's strongest trending metric is Growth; it's been moving up over the last 179 days.
- RLI ranks lowest in Value; there it ranks in the 18th percentile.
RLI Stock Summary
- RLI CORP's stock had its IPO on December 30, 1987, making it an older stock than 90.88% of US equities in our set.
- In terms of twelve month growth in earnings before interest and taxes, RLI CORP is reporting a growth rate of 147.19%; that's higher than 90.79% of US stocks.
- As for revenue growth, note that RLI's revenue has grown 55.45% over the past 12 months; that beats the revenue growth of 88.73% of US companies in our set.
- Stocks that are quantitatively similar to RLI, based on their financial statements, market capitalization, and price volatility, are ORI, COKE, AAP, IPAR, and VSH.
- Visit RLI's SEC page to see the company's official filings. To visit the company's web site, go to www.rlicorp.com.
RLI Valuation Summary
- In comparison to the median Financial Services stock, RLI's price/earnings ratio is 8.24% higher, now standing at 9.2.
- RLI's EV/EBIT ratio has moved down 5.7 over the prior 243 months.
Below are key valuation metrics over time for RLI.
Stock | Date | P/S | P/B | P/E | EV/EBIT |
---|---|---|---|---|---|
RLI | 2023-05-19 | 3.3 | 4.5 | 9.2 | 7.6 |
RLI | 2023-05-18 | 3.3 | 4.5 | 9.3 | 7.6 |
RLI | 2023-05-17 | 3.3 | 4.5 | 9.3 | 7.6 |
RLI | 2023-05-16 | 3.3 | 4.6 | 9.4 | 7.8 |
RLI | 2023-05-15 | 3.4 | 4.7 | 9.6 | 7.9 |
RLI | 2023-05-12 | 3.4 | 4.7 | 9.6 | 7.9 |
RLI Growth Metrics
- Its 3 year revenue growth rate is now at 29.09%.
- The year over year price growth rate now stands at 3.25%.
- Its 3 year price growth rate is now at 48.5%.

The table below shows RLI's growth in key financial areas (numbers in millions of US dollars).
Date | Revenue | Operating Cash Flow | Net Income to Common Stock |
---|---|---|---|
2022-09-30 | 1,660.763 | 387.35 | 580.861 |
2022-06-30 | 1,071.739 | 391.041 | 170.211 |
2022-03-31 | 1,156.727 | 363.632 | 254.265 |
2021-12-31 | 1,179.245 | 384.905 | 279.354 |
2021-09-30 | 1,160.332 | 380.456 | 267.875 |
2021-06-30 | 1,152.673 | 343.995 | 281.019 |
RLI's Quality Factors
The “Quality” component of the POWR Ratings focuses on 31 different factors of a companies fundamentals and operational strength. Here are some key insights as we drill into the specifics of these quality attributes.- RLI has a Quality Grade of C, ranking ahead of 58.13% of graded US stocks.
- RLI's asset turnover comes in at 0.279 -- ranking 63rd of 133 Insurance stocks.
- UNM, MDWT, and GNW are the stocks whose asset turnover ratios are most correlated with RLI.
The table below shows RLI's key quality metrics over time.
Period | Asset Turnover | Gross Margin | ROIC |
---|---|---|---|
2021-09-30 | 0.279 | 0.605 | 0.081 |
2021-06-30 | 0.288 | 0.616 | 0.088 |
2021-03-31 | 0.301 | 0.621 | 0.095 |
2020-12-31 | 0.267 | 0.550 | 0.053 |
2020-09-30 | 0.263 | 0.527 | 0.044 |
2020-06-30 | 0.261 | 0.534 | 0.041 |
RLI Price Target
For more insight on analysts targets of RLI, see our RLI price target page. And for a list of of all stocks sorted by upside potential based on analyst target price, see our Top Price Target page.
Average Price Target | $118.00 | Average Broker Recommendation | 1.86 (Hold) |
RLI Corp. (RLI) Company Bio
RLI Corporation underwrites property and casualty insurance primarily in the United States. Its Casualty segment provides commercial and personal umbrella coverage products; and general liability products consisting of coverage for third party liability of commercial insureds, including manufacturers, contractors, apartments, real estate investment trusts, and mercantile. The company was founded in 1965 and is based in Peoria, Illinois.
Latest RLI News From Around the Web
Below are the latest news stories about RLI CORP that investors may wish to consider to help them evaluate RLI as an investment opportunity.
Progressive (PGR) April Earnings and Revenues Improve Y/YProgressive's (PGR) April earnings reflect higher revenues, partially offset by higher expenses. |
Why Is RLI Corp. (RLI) Down 12.4% Since Last Earnings Report?RLI Corp. (RLI) reported earnings 30 days ago. What's next for the stock? We take a look at earnings estimates for some clues. |
Chubb Limited's (CB) Board Okays 3.6% Dividend IncreaseChubb's (CB) dividend hike reflect its strong capital position. Its cash generation capabilities are supported by its underwriting and investment performance. |
Reasons Why Investors Should Retain American Financial (AFG)American Financial (AFG) stands to gain from growth in the surplus lines and excess liability businesses, rate increases, higher retentions and effective capital deployment. |
Should You Retain CNA Financial (CNA) Stock in Your Portfolio?CNA Financial (CNA) is poised to grow on the back of new business growth, higher net earned premium, proper management of catastrophe exposures and favorable reinvestment yields. |
RLI Price Returns
1-mo | -11.80% |
3-mo | -9.46% |
6-mo | -5.68% |
1-year | 8.91% |
3-year | 75.16% |
5-year | 118.84% |
YTD | -5.26% |
2022 | 24.80% |
2021 | 10.67% |
2020 | 18.08% |
2019 | 33.22% |
2018 | 16.69% |
RLI Dividends
Ex-Dividend Date | Type | Payout Amount | Change | ||||||
---|---|---|---|---|---|---|---|---|---|
Loading, please wait... |
Continue Researching RLI
Want to see what other sources are saying about Rli Corp's financials and stock price? Try the links below:Rli Corp (RLI) Stock Price | Nasdaq
Rli Corp (RLI) Stock Quote, History and News - Yahoo Finance
Rli Corp (RLI) Stock Price and Basic Information | MarketWatch
Loading social stream, please wait...