Regional Management Corp. (RM): Price and Financial Metrics
GET POWR RATINGS... FREE!
RM POWR Grades
- RM scores best on the Quality dimension, with a Quality rank ahead of 91.88% of US stocks.
- RM's strongest trending metric is Momentum; it's been moving down over the last 179 days.
- RM ranks lowest in Sentiment; there it ranks in the 52nd percentile.
RM Stock Summary
- With a price/earnings ratio of 5.38, Regional Management Corp P/E ratio is greater than that of about only 7.59% of stocks in our set with positive earnings.
- The price/operating cash flow metric for Regional Management Corp is higher than only 7.67% of stocks in our set with a positive cash flow.
- Shareholder yield, a measure of how much is returned to shareholders via dividends and share repurchases, for RM comes in at -53.11% -- higher than that of only 8.46% of stocks in our set.
- Stocks with similar financial metrics, market capitalization, and price volatility to Regional Management Corp are NXST, MCRI, NP, CLH, and NNBR.
- RM's SEC filings can be seen here. And to visit Regional Management Corp's official web site, go to www.regionalmanagement.com.
RM Valuation Summary
- RM's price/earnings ratio is 8.2; this is 25.45% lower than that of the median Financial Services stock.
- RM's price/sales ratio has moved down 0.4 over the prior 114 months.
- Over the past 114 months, RM's EV/EBIT ratio has gone up 1.4.
Below are key valuation metrics over time for RM.
Stock | Date | P/S | P/B | P/E | EV/EBIT |
---|---|---|---|---|---|
RM | 2021-07-16 | 1.4 | 1.8 | 8.9 | 10.6 |
RM | 2019-06-07 | 0.9 | 1.0 | 8.6 | 11.1 |
RM | 2016-07-26 | 0.8 | 1.0 | 7.7 | 10.5 |
RM | 2015-05-15 | 1.1 | 1.2 | 17.0 | 14.8 |
RM | 2015-04-28 | 0.9 | 1.0 | 12.6 | 13.5 |
RM | 2013-11-14 | 2.5 | 2.6 | 14.5 | 13.0 |
RM Growth Metrics
- Its 3 year price growth rate is now at 42.84%.
- Its 4 year cash and equivalents growth rate is now at 279.74%.
- The 2 year price growth rate now stands at -56.28%.

The table below shows RM's growth in key financial areas (numbers in millions of US dollars).
Date | Revenue | Operating Cash Flow | Net Income to Common Stock |
---|---|---|---|
2021-09-30 | 406.311 | 183.464 | 82.256 |
2021-06-30 | 385.389 | 174.124 | 71.273 |
2021-03-31 | 375.563 | 170.351 | 58.577 |
2020-12-31 | 373.906 | 172.582 | 26.73 |
2020-09-30 | 374.446 | 175.311 | 28.066 |
2020-06-30 | 375.615 | 182.564 | 29.4 |
RM's Quality Factors
The “Quality” component of the POWR Ratings focuses on 31 different factors of a companies fundamentals and operational strength. Here are some key insights as we drill into the specifics of these quality attributes.- RM has a Quality Grade of B, ranking ahead of 92.69% of graded US stocks.
- RM's asset turnover comes in at 0.345 -- ranking 21st of 428 Banking stocks.
- PFS, ESXB, and LC are the stocks whose asset turnover ratios are most correlated with RM.
The table below shows RM's key quality metrics over time.
Period | Asset Turnover | Gross Margin | ROIC |
---|---|---|---|
2021-09-30 | 0.345 | 1 | 0.072 |
2021-06-30 | 0.348 | 1 | 0.070 |
2021-03-31 | 0.354 | 1 | 0.066 |
2020-12-31 | 0.354 | 1 | 0.043 |
2020-09-30 | 0.350 | 1 | 0.044 |
2020-06-30 | 0.347 | 1 | 0.044 |
RM Price Target
For more insight on analysts targets of RM, see our RM price target page. And for a list of of all stocks sorted by upside potential based on analyst target price, see our Top Price Target page.
Average Price Target | $47.50 | Average Broker Recommendation | 1.83 (Hold) |
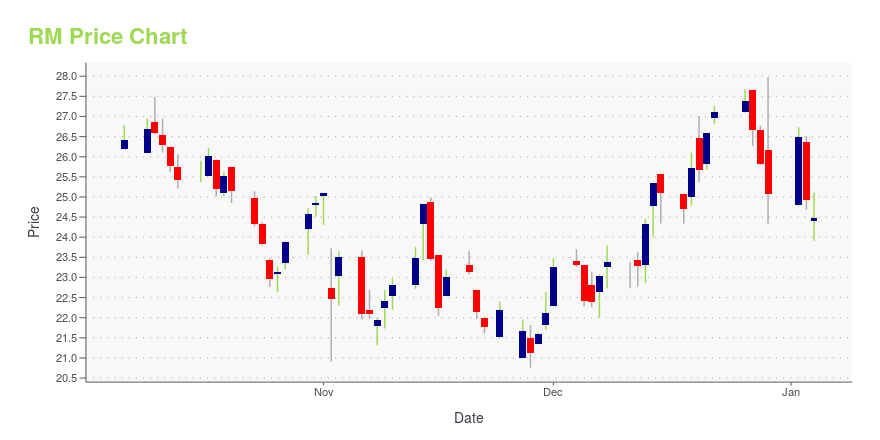
RM Stock Price Chart Interactive Chart >
RM Price/Volume Stats
Current price | $37.37 | 52-week high | $67.60 |
Prev. close | $38.04 | 52-week low | $37.02 |
Day low | $37.02 | Volume | 24,500 |
Day high | $37.75 | Avg. volume | 41,304 |
50-day MA | $43.45 | Dividend yield | 3.21% |
200-day MA | $51.29 | Market Cap | 361.44M |
Regional Management Corp. (RM) Company Bio
Regional Management Corporation is a diversified specialty consumer finance company providing a broad array of loan products primarily to customers with limited access to consumer credit from banks, thrifts, credit card companies and other traditional lenders. The company was founded in 1987 and is based in Greenville, South Carolina.
Latest RM News From Around the Web
Below are the latest news stories about Regional Management Corp that investors may wish to consider to help them evaluate RM as an investment opportunity.
Regional Management Corp. Completes $250 Million Asset-Backed SecuritizationGREENVILLE, S.C., February 24, 2022--Regional Management Corp. (NYSE: RM), a diversified consumer finance company, announced today that it has completed a $250 million asset-backed securitization, its eighth securitization and largest to date. |
Regional Management Corp. (NYSE:RM) Looks Interesting, And It's About To Pay A DividendReaders hoping to buy Regional Management Corp. ( NYSE:RM ) for its dividend will need to make their move shortly, as... |
How to Profit in an Inflationary EnvironmentWall Street is easily distracted by global issues and inflation concerns. |
Why Wall Street Panicked Over the CPI ReportCPI soared to a 7.5% annual gain in January, exceeding economists’ estimates for a 7.3% increase. |
Regional Management Corp. Consensus Indicates Potential 11.3% UpsideRegional Management Corp. found using ticker (RM) have now 5 analysts in total covering the stock. The consensus rating is ''Hold''. The target price ranges between 68 and 54 with the average target price sitting at 60. Given that the stocks previous close was at 53.89 this now indicates there is a potential upside of 11.3%. The 50 day moving average now sits at 54.07 and the 200 day MA is 53.44. The company has a market cap of $508m. You can visit the company''s website by visiting: https://www.regionalmanagement.com [stock_market_widget type="chart" symbol="RM" chart="bar" range="6mo" interval="1d" line-color="rgb(49, 125, 189)"] The potential market cap would be $565m based on the market concensus. Regional Management Corp. (NYSE: RM) is a diversified consumer finance company that pr... |
RM Price Returns
1-mo | -21.16% |
3-mo | -22.45% |
6-mo | -34.16% |
1-year | -18.63% |
3-year | 49.10% |
5-year | 64.69% |
YTD | -34.16% |
2021 | 96.32% |
2020 | 0.26% |
2019 | 24.86% |
2018 | -8.59% |
2017 | 0.11% |
RM Dividends
Ex-Dividend Date | Type | Payout Amount | Change | ||||||
---|---|---|---|---|---|---|---|---|---|
Loading, please wait... |
Continue Researching RM
Want to do more research on Regional Management Corp's stock and its price? Try the links below:Regional Management Corp (RM) Stock Price | Nasdaq
Regional Management Corp (RM) Stock Quote, History and News - Yahoo Finance
Regional Management Corp (RM) Stock Price and Basic Information | MarketWatch
Loading social stream, please wait...