RE/MAX Holdings, Inc. (RMAX): Price and Financial Metrics
GET POWR RATINGS... FREE!
RMAX POWR Grades
- Growth is the dimension where RMAX ranks best; there it ranks ahead of 80.64% of US stocks.
- The strongest trend for RMAX is in Stability, which has been heading up over the past 177 days.
- RMAX ranks lowest in Sentiment; there it ranks in the 5th percentile.
RMAX Stock Summary
- With a price/earnings ratio of 50.13, RE/MAX HOLDINGS INC P/E ratio is greater than that of about 88.88% of stocks in our set with positive earnings.
- Over the past twelve months, RMAX has reported earnings growth of -1,996.53%, putting it ahead of merely 1.04% of US stocks in our set.
- Shareholder yield, a measure of how much is returned to shareholders via dividends and share repurchases, for RMAX comes in at 18.57% -- higher than that of 89.92% of stocks in our set.
- Stocks that are quantitatively similar to RMAX, based on their financial statements, market capitalization, and price volatility, are BOOM, MEC, PVBC, NESR, and FRGI.
- Visit RMAX's SEC page to see the company's official filings. To visit the company's web site, go to www.remax.com.
RMAX Valuation Summary
- RMAX's price/sales ratio is 0.9; this is 10% lower than that of the median Real Estate stock.
- RMAX's price/sales ratio has moved down 1 over the prior 115 months.
Below are key valuation metrics over time for RMAX.
Stock | Date | P/S | P/B | P/E | EV/EBIT |
---|---|---|---|---|---|
RMAX | 2023-03-23 | 0.9 | 0.6 | 50.2 | 19.3 |
RMAX | 2023-03-22 | 0.9 | 0.6 | 49.3 | 19.1 |
RMAX | 2023-03-21 | 0.9 | 0.6 | 50.8 | 19.3 |
RMAX | 2023-03-20 | 0.9 | 0.6 | 50.3 | 19.3 |
RMAX | 2023-03-17 | 0.9 | 0.6 | 49.5 | 19.1 |
RMAX | 2023-03-16 | 0.9 | 0.7 | 51.8 | 19.5 |
RMAX Growth Metrics
- The 5 year net income to common stockholders growth rate now stands at 2.44%.
- Its 5 year net cashflow from operations growth rate is now at 6.34%.
- Its 5 year revenue growth rate is now at 54.94%.

The table below shows RMAX's growth in key financial areas (numbers in millions of US dollars).
Date | Revenue | Operating Cash Flow | Net Income to Common Stock |
---|---|---|---|
2022-09-30 | 361.282 | 87.184 | 10.529 |
2022-06-30 | 363.336 | 51.022 | -14.76 |
2022-03-31 | 348.41 | 38.112 | -15.388 |
2021-12-31 | 329.701 | 42.442 | -15.616 |
2021-09-30 | 312.987 | 44.02 | -17.489 |
2021-06-30 | 293.063 | 84.863 | 11.137 |
RMAX's Quality Factors
The “Quality” component of the POWR Ratings focuses on 31 different factors of a companies fundamentals and operational strength. Here are some key insights as we drill into the specifics of these quality attributes.- RMAX has a Quality Grade of C, ranking ahead of 63.88% of graded US stocks.
- RMAX's asset turnover comes in at 0.531 -- ranking 17th of 63 Real Estate stocks.
- AHH, LEJU, and VWTR are the stocks whose asset turnover ratios are most correlated with RMAX.
The table below shows RMAX's key quality metrics over time.
Period | Asset Turnover | Gross Margin | ROIC |
---|---|---|---|
2021-06-30 | 0.531 | 0.757 | 0.077 |
2021-03-31 | 0.490 | 0.757 | 0.071 |
2020-12-31 | 0.491 | 0.758 | 0.088 |
2020-09-30 | 0.487 | 0.755 | 0.092 |
2020-06-30 | 0.490 | 0.753 | 0.114 |
2020-03-31 | 0.527 | 0.748 | 0.137 |
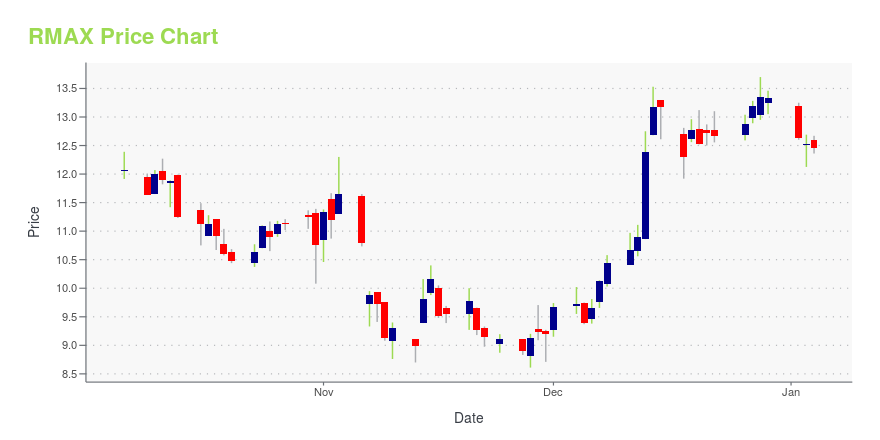
RMAX Stock Price Chart Interactive Chart >
RMAX Price/Volume Stats
Current price | $18.76 | 52-week high | $28.86 |
Prev. close | $17.45 | 52-week low | $16.78 |
Day low | $17.50 | Volume | 300,600 |
Day high | $18.77 | Avg. volume | 140,724 |
50-day MA | $19.84 | Dividend yield | 5.25% |
200-day MA | $21.07 | Market Cap | 334.30M |
RE/MAX Holdings, Inc. (RMAX) Company Bio
RE/MAX Holdings operates as a franchisor of residential and commercial real estate brokerage services in the United States and internationally. It operates in two segments, Real Estate Franchise Services and Brokerages. The company was founded in 1973 and is based in Denver, Colorado.
Latest RMAX News From Around the Web
Below are the latest news stories about RE/MAX HOLDINGS INC that investors may wish to consider to help them evaluate RMAX as an investment opportunity.
U.S. real estate brokerages must face home sellers’ class action over commissionsA federal judge in Chicago on Wednesday ruled that home sellers accusing the National Association of Realtors and a group of real estate brokerages of conspiring to inflate commission rates can move forward as a class action. U.S. District Judge Andrea Wood's decision grants class-action status to past home sellers seeking more than $13 billion in damages and creates a separate class of current and future sellers who want a court injunction that bars subsequent violations of U.S. antitrust law. The plaintiffs are seven home sellers. |
Gen Z Homebuyers Consider Smart Features, New Builds and Prioritize Sustainable Materials, New Survey ShowsWith 2022 having seen a notable increase in mortgage rates compared to historical lows in 2020-21, and with many economic factors to watch based on the first quarter of 2023, many U.S. homebuyers and sellers are rethinking their approach to achieving their real estate goals, according to a study commissioned by RE/MAX, the #1 name in real estate*. |
The Rate Hike Wall Street ExpectedIn this Motley Fool Money podcast, Motley Fool Chief Investment Officer Andy Cross discusses: The Fed's latest 0.25 percentage point rate hike. The unfortunate timing that had Fed Chairman Jerome Powell's press conference and Treasury Secretary Janet Yellen's public testimony before Congress occurring simultaneously. |
RE/MAX Reveals Impactful Speaker Lineup for 2023 Global Commercial SymposiumRE/MAX, the #1 name in real estate* today announced a dynamic group of speakers for the upcoming 2023 RE/MAX Global Commercial Symposium, taking place from April 24-26 at the Renaissance Chicago Downtown Hotel in Chicago, Illinois. The three-day event has been tailored to provide resources and networking opportunities to commercial real estate professionals looking to grow their business and will also offer valuable insights to those interested in expanding their real estate business into the co |
RE/MAX National Housing Report for February 2023Despite being down 24.4% year over year, February home sales increased 16.8% from January. That was the largest month-over-month increase in 11 months and ended a five-month streak of sales declines that began in September. |
RMAX Price Returns
1-mo | 2.27% |
3-mo | 1.94% |
6-mo | 1.71% |
1-year | -29.37% |
3-year | -5.48% |
5-year | -64.11% |
YTD | 1.94% |
2022 | -36.50% |
2021 | -13.88% |
2020 | -2.74% |
2019 | 28.28% |
2018 | -35.47% |
RMAX Dividends
Ex-Dividend Date | Type | Payout Amount | Change | ||||||
---|---|---|---|---|---|---|---|---|---|
Loading, please wait... |
Continue Researching RMAX
Here are a few links from around the web to help you further your research on RE/MAX Holdings Inc's stock as an investment opportunity:RE/MAX Holdings Inc (RMAX) Stock Price | Nasdaq
RE/MAX Holdings Inc (RMAX) Stock Quote, History and News - Yahoo Finance
RE/MAX Holdings Inc (RMAX) Stock Price and Basic Information | MarketWatch
Loading social stream, please wait...