Rambus, Inc. (RMBS): Price and Financial Metrics
RMBS Price/Volume Stats
Current price | $61.81 | 52-week high | $76.38 |
Prev. close | $63.10 | 52-week low | $43.58 |
Day low | $61.70 | Volume | 1,989,700 |
Day high | $63.49 | Avg. volume | 1,673,262 |
50-day MA | $62.76 | Dividend yield | N/A |
200-day MA | $60.75 | Market Cap | 6.71B |
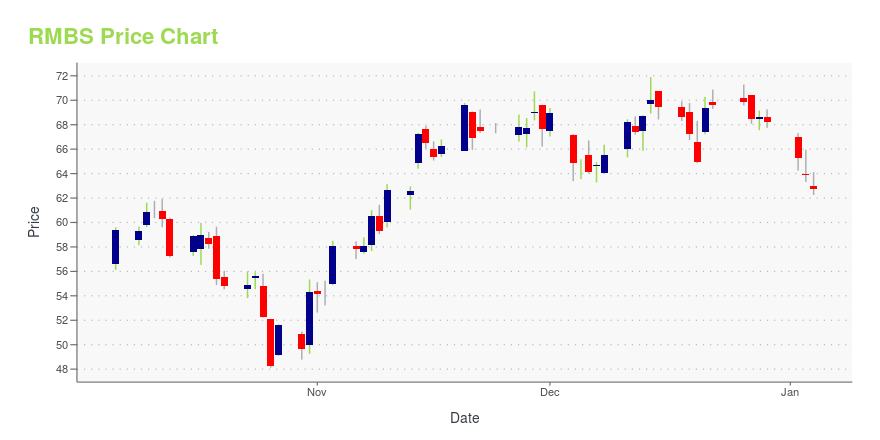
RMBS Stock Price Chart Interactive Chart >
RMBS POWR Grades
- RMBS scores best on the Quality dimension, with a Quality rank ahead of 92.9% of US stocks.
- RMBS's strongest trending metric is Quality; it's been moving down over the last 26 weeks.
- RMBS ranks lowest in Stability; there it ranks in the 19th percentile.
RMBS Stock Summary
- RMBS's price/sales ratio is 14.9; that's higher than the P/S ratio of 92.67% of US stocks.
- With a year-over-year growth in debt of -34%, RAMBUS INC's debt growth rate surpasses merely 9.33% of about US stocks.
- Over the past twelve months, RMBS has reported earnings growth of -1,254.43%, putting it ahead of merely 1.24% of US stocks in our set.
- Stocks with similar financial metrics, market capitalization, and price volatility to RAMBUS INC are VECO, CRNC, PGEN, SAGE, and CPTN.
- RMBS's SEC filings can be seen here. And to visit RAMBUS INC's official web site, go to www.rambus.com.
RMBS Valuation Summary
- In comparison to the median Technology stock, RMBS's price/earnings ratio is 9.19% lower, now standing at 24.2.
- Over the past 243 months, RMBS's price/sales ratio has gone down 11.1.
Below are key valuation metrics over time for RMBS.
Stock | Date | P/S | P/B | P/E | EV/EBIT |
---|---|---|---|---|---|
RMBS | 2023-12-08 | 15.3 | 7.4 | 24.2 | 48.8 |
RMBS | 2023-12-07 | 15.1 | 7.3 | 23.9 | 48.1 |
RMBS | 2023-12-06 | 14.9 | 7.2 | 23.7 | 47.7 |
RMBS | 2023-12-05 | 15.0 | 7.3 | 23.8 | 48.0 |
RMBS | 2023-12-04 | 15.1 | 7.3 | 23.9 | 48.3 |
RMBS | 2023-12-01 | 16.1 | 7.8 | 25.4 | 51.3 |
RMBS Growth Metrics
- The 4 year price growth rate now stands at 21.73%.
- Its 2 year cash and equivalents growth rate is now at 2.1%.
- Its 5 year net cashflow from operations growth rate is now at 46.63%.
The table below shows RMBS's growth in key financial areas (numbers in millions of US dollars).
Date | Revenue | Operating Cash Flow | Net Income to Common Stock |
---|---|---|---|
2022-12-31 | 454.793 | 230.393 | -14.31 |
2022-09-30 | 424.207 | 251.272 | -24.154 |
2022-06-30 | 393.245 | 217.278 | -21.417 |
2022-03-31 | 356.972 | 212.373 | -45.271 |
2021-12-31 | 328.304 | 209.217 | 18.334 |
2021-09-30 | 302.011 | 179.116 | 3.301 |
RMBS's Quality Factors
The “Quality” component of the POWR Ratings focuses on 31 different factors of a companies fundamentals and operational strength. Here are some key insights as we drill into the specifics of these quality attributes.- RMBS has a Quality Grade of B, ranking ahead of 87.11% of graded US stocks.
- RMBS's asset turnover comes in at 0.225 -- ranking 177th of 208 Electronic Equipment stocks.
- POLY, MCHP, and JBL are the stocks whose asset turnover ratios are most correlated with RMBS.
The table below shows RMBS's key quality metrics over time.
Period | Asset Turnover | Gross Margin | ROIC |
---|---|---|---|
2021-06-30 | 0.225 | 0.773 | 0.002 |
2021-03-31 | 0.198 | 0.754 | -0.021 |
2020-12-31 | 0.190 | 0.753 | -0.025 |
2020-12-31 | 0.187 | 0.750 | -0.028 |
2020-09-30 | 0.182 | 0.743 | -0.026 |
2020-06-30 | 0.183 | 0.755 | -0.033 |
RMBS Price Target
For more insight on analysts targets of RMBS, see our RMBS price target page. And for a list of of all stocks sorted by upside potential based on analyst target price, see our Top Price Target page.
Average Price Target | $26.10 | Average Broker Recommendation | 1.67 (Moderate Buy) |
Rambus, Inc. (RMBS) Company Bio
Rambus Inc.'s technology solutions include memory, chip interfaces and architectures, end-to-end security, and advanced LED lighting. The company was founded in 1990 and is based in Sunnyvale, California.
Latest RMBS News From Around the Web
Below are the latest news stories about RAMBUS INC that investors may wish to consider to help them evaluate RMBS as an investment opportunity.
Rambus (RMBS) Introduces Industry's First Gen4 DDR5 RCDRambus (RMBS) introduces Gen4 DDR5 Registering Clock Driver for data center workloads with data rate capabilities of up to 7200 MT/s. |
13 Cash-Rich Small Cap Stocks To Invest InIn this piece, we will take a look at the 13 cash rich small cap stocks to invest in. If you want to skip our introduction to small cap investing and the latest stock market news, then you can take a look at the 5 Cash-Rich Small Cap Stocks To Invest In. Small cap stocks […] |
Rambus Advances Data Center Server Performance with Industry-First Gen4 DDR5 RCDSAN JOSE, Calif., December 27, 2023--Rambus announced the availability of its state-of-the-art Gen4 DDR5 RCD, boosting the data rate to 7200 MT/s. |
Why Rambus (RMBS) Outpaced the Stock Market TodayRambus (RMBS) reachead $69.65 at the closing of the latest trading day, reflecting a +0.43% change compared to its last close. |
Rambus (RMBS) Stock Dips While Market Gains: Key FactsIn the closing of the recent trading day, Rambus (RMBS) stood at $68.62, denoting a -1.22% change from the preceding trading day. |
RMBS Price Returns
1-mo | 8.71% |
3-mo | -9.44% |
6-mo | 10.79% |
1-year | 22.32% |
3-year | 222.09% |
5-year | 491.48% |
YTD | -9.44% |
2023 | 90.54% |
2022 | 21.88% |
2021 | 68.33% |
2020 | 26.75% |
2019 | 79.60% |
Continue Researching RMBS
Here are a few links from around the web to help you further your research on Rambus Inc's stock as an investment opportunity:Rambus Inc (RMBS) Stock Price | Nasdaq
Rambus Inc (RMBS) Stock Quote, History and News - Yahoo Finance
Rambus Inc (RMBS) Stock Price and Basic Information | MarketWatch
Loading social stream, please wait...