
ResMed Inc. (RMD): Price and Financial Metrics
RMD Price/Volume Stats
| Current price | $197.04 | 52-week high | $229.97 |
| Prev. close | $208.34 | 52-week low | $132.24 |
| Day low | $196.43 | Volume | 1,896,839 |
| Day high | $207.04 | Avg. volume | 1,052,489 |
| 50-day MA | $205.01 | Dividend yield | 0.92% |
| 200-day MA | $182.79 | Market Cap | 28.95B |
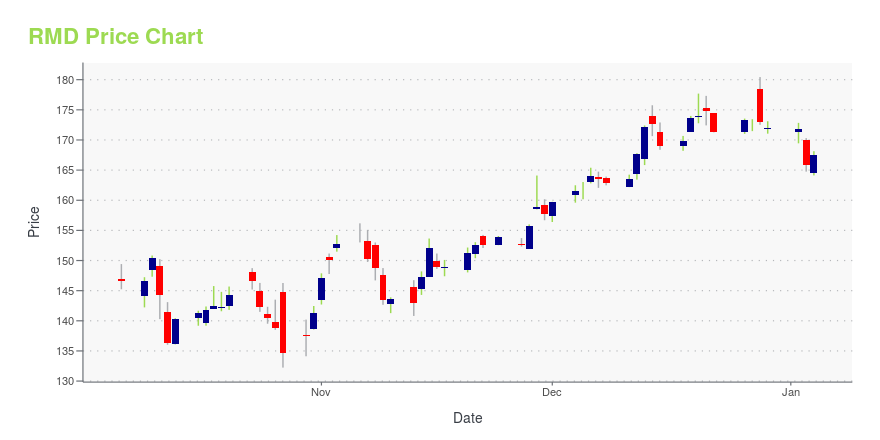
RMD Stock Price Chart Interactive Chart >
ResMed Inc. (RMD) Company Bio
ResMed is a San Diego, California-based medical device company. It primarily provides cloud-connectable CPAP devices and masks for the treatment of sleep apnea, as well as devices and masks for treating chronic obstructive pulmonary disease (COPD), neuromuscular disease, and other respiratory-related conditions. It also provides a self-monitoring digital sensor and app for people who use inhalers to treat COPD or asthma via Propeller Health, which ResMed acquired in 2019. (Source:Wikipedia)
Latest RMD News From Around the Web
Below are the latest news stories about RESMED INC that investors may wish to consider to help them evaluate RMD as an investment opportunity.
ResMed Announces Participation in the 42nd Annual J.P. Morgan Healthcare ConferenceSAN DIEGO, Dec. 27, 2023 (GLOBE NEWSWIRE) -- ResMed (NYSE: RMD, ASX: RMD) today announced Mick Farrell, chief executive officer and chair of the board, will present at the 42nd Annual J.P. Morgan Healthcare Conference on Monday, January 8, 2024, beginning at approximately 2:15 p.m. (Pacific Standard Time) at the Westin St. Francis in San Francisco, CA. More information about this event, including access to the live, audio-only webcast, may be accessed by visiting https://investor.resmed.com. The |
Resmed posts notice about risk of mask magnets interfering with medical implantsLike its rival Philips, Resmed has determined that patients should not wear magnetized masks near some implants. |
ResMed Notifies Customers About Updated Instructions and Labeling for Masks with Magnets Due to Potential Interference with Certain Medical DevicesResMed’s masks with magnets are safe when used in accordance with the updated Instructions for UseSAN DIEGO, Dec. 20, 2023 (GLOBE NEWSWIRE) -- ResMed (NYSE: RMD, ASX: RMD) is conducting a voluntary global field action to update its guides for all masks with magnets to inform users about potential magnetic interference when magnets are near certain implants and medical devices in the body. This voluntary field correction does not require a return of a mask with magnets unless the patient is contr |
Resmed hails ‘significant victory’ as patent board rules in dispute with NYUThe decisions invalidate claims that NYU argued were infringed by Resmed’s sleep apnea devices. |
Here's Why Investors Should Retain ResMed (RMD) Stock for NowInvestors continue to be optimistic about ResMed (RMD) due to the sustained growth in the SaaS business. |
RMD Price Returns
| 1-mo | 5.63% |
| 3-mo | -9.44% |
| 6-mo | 4.12% |
| 1-year | -10.10% |
| 3-year | -23.52% |
| 5-year | 62.19% |
| YTD | 15.09% |
| 2023 | -16.55% |
| 2022 | -19.47% |
| 2021 | 23.41% |
| 2020 | 38.33% |
| 2019 | 37.85% |
RMD Dividends
| Ex-Dividend Date | Type | Payout Amount | Change | ||||||
|---|---|---|---|---|---|---|---|---|---|
| Loading, please wait... | |||||||||
Continue Researching RMD
Want to do more research on Resmed Inc's stock and its price? Try the links below:Resmed Inc (RMD) Stock Price | Nasdaq
Resmed Inc (RMD) Stock Quote, History and News - Yahoo Finance
Resmed Inc (RMD) Stock Price and Basic Information | MarketWatch
Loading social stream, please wait...