
The RMR Group Inc. - (RMR): Price and Financial Metrics
RMR Price/Volume Stats
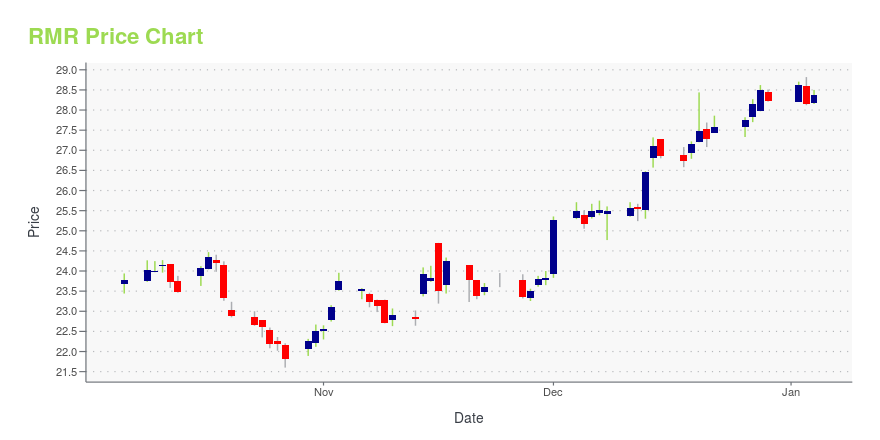
| Current price | $25.58 | 52-week high | $28.82 |
| Prev. close | $25.48 | 52-week low | $21.60 |
| Day low | $25.16 | Volume | 81,300 |
| Day high | $25.74 | Avg. volume | 92,497 |
| 50-day MA | $23.62 | Dividend yield | 7.13% |
| 200-day MA | $24.30 | Market Cap | 811.68M |
RMR Stock Price Chart Interactive Chart >
The RMR Group Inc. - (RMR) Company Bio
The RMR Group LLC, provides business and property management services in the United States. The company was founded in 1986 and is based in Newton, Massachusetts.
Latest RMR News From Around the Web
Below are the latest news stories about RMR GROUP INC that investors may wish to consider to help them evaluate RMR as an investment opportunity.
The RMR Group Completes Acquisition of CARROLL Multifamily PlatformNEWTON, Mass., December 19, 2023--The RMR Group (Nasdaq: RMR) today announced that it has completed its acquisition of MPC Partnership Holdings, LLC, doing business as CARROLL ("CARROLL"), a vertically integrated multifamily platform. The acquisition, which was announced on July 31, 2023, expands RMR’s platform to include multifamily commercial real estate, the only major property sector in which RMR did not have a significant presence, increases its private capital assets under management and d |
Investors in RMR Group (NASDAQ:RMR) have unfortunately lost 38% over the last five yearsThe RMR Group Inc. ( NASDAQ:RMR ) shareholders should be happy to see the share price up 11% in the last month. But if... |
Looking to Lock In Some High Yields for 2024? 3 Stocks to Buy in December.Higher-yielding dividend stocks took a hit in 2023. Rising interest rates made lower-risk income investments like bonds and bank CDs more attractive. Because of that, investors can lock in some pretty attractive yields heading into 2024. |
The RMR Group Named a Top Place to Work by The Boston Globe for the Fourth Consecutive YearNEWTON, Mass., November 30, 2023--The RMR Group (Nasdaq: RMR) today announced that for the fourth consecutive year it has been named as one of the Top Places to Work in Massachusetts by The Boston Globe. |
Should You Think About Buying The RMR Group Inc. (NASDAQ:RMR) Now?The RMR Group Inc. ( NASDAQ:RMR ), is not the largest company out there, but it saw a decent share price growth in the... |
RMR Price Returns
| 1-mo | 12.64% |
| 3-mo | 8.71% |
| 6-mo | -0.33% |
| 1-year | 13.66% |
| 3-year | -7.63% |
| 5-year | -19.67% |
| YTD | -6.18% |
| 2023 | 6.48% |
| 2022 | -13.93% |
| 2021 | 10.33% |
| 2020 | -11.24% |
| 2019 | -11.65% |
RMR Dividends
| Ex-Dividend Date | Type | Payout Amount | Change | ||||||
|---|---|---|---|---|---|---|---|---|---|
| Loading, please wait... | |||||||||
Continue Researching RMR
Here are a few links from around the web to help you further your research on Rmr Group Inc's stock as an investment opportunity:Rmr Group Inc (RMR) Stock Price | Nasdaq
Rmr Group Inc (RMR) Stock Quote, History and News - Yahoo Finance
Rmr Group Inc (RMR) Stock Price and Basic Information | MarketWatch
Loading social stream, please wait...