Rogers Corporation (ROG): Price and Financial Metrics
GET POWR RATINGS... FREE!
ROG POWR Grades
- Quality is the dimension where ROG ranks best; there it ranks ahead of 69.37% of US stocks.
- The strongest trend for ROG is in Value, which has been heading down over the past 179 days.
- ROG's current lowest rank is in the Growth metric (where it is better than 6.61% of US stocks).
ROG Stock Summary
- ROG's went public 36.27 years ago, making it older than 92.84% of listed US stocks we're tracking.
- Price to trailing twelve month operating cash flow for ROG is currently 41.25, higher than 86.97% of US stocks with positive operating cash flow.
- With a year-over-year growth in debt of 660%, Rogers Corp's debt growth rate surpasses 97.73% of about US stocks.
- Stocks that are quantitatively similar to ROG, based on their financial statements, market capitalization, and price volatility, are ICUI, PMD, SPNE, BSQR, and TELA.
- ROG's SEC filings can be seen here. And to visit Rogers Corp's official web site, go to www.rogerscorp.com.
ROG Valuation Summary
- ROG's EV/EBIT ratio is 32; this is 0.78% lower than that of the median Technology stock.
- Over the past 243 months, ROG's price/sales ratio has gone up 2.7.
- Over the past 243 months, ROG's EV/EBIT ratio has gone up 19.5.
Below are key valuation metrics over time for ROG.
Stock | Date | P/S | P/B | P/E | EV/EBIT |
---|---|---|---|---|---|
ROG | 2021-09-01 | 4.5 | 3.7 | 47.9 | 32.0 |
ROG | 2021-08-31 | 4.5 | 3.7 | 48.5 | 32.4 |
ROG | 2021-08-30 | 4.6 | 3.7 | 48.8 | 32.7 |
ROG | 2021-08-27 | 4.5 | 3.7 | 48.1 | 32.2 |
ROG | 2021-08-26 | 4.3 | 3.5 | 46.3 | 30.9 |
ROG | 2021-08-25 | 4.4 | 3.6 | 47.4 | 31.7 |
ROG Growth Metrics
- The year over year price growth rate now stands at 80.75%.
- Its 5 year cash and equivalents growth rate is now at 34.5%.
- Its year over year net cashflow from operations growth rate is now at 26.19%.

The table below shows ROG's growth in key financial areas (numbers in millions of US dollars).
Date | Revenue | Operating Cash Flow | Net Income to Common Stock |
---|---|---|---|
2021-12-31 | 932.886 | 124.363 | 108.133 |
2021-09-30 | 913.106 | 157.498 | 100.207 |
2021-06-30 | 876.787 | 176.303 | 82.084 |
2021-03-31 | 833.038 | 192.944 | 67.949 |
2020-12-31 | 802.583 | 165.056 | 49.99 |
2020-09-30 | 785.679 | 159.324 | 6.025 |
ROG's Quality Factors
The “Quality” component of the POWR Ratings focuses on 31 different factors of a companies fundamentals and operational strength. Here are some key insights as we drill into the specifics of these quality attributes.- ROG has a Quality Grade of B, ranking ahead of 90.37% of graded US stocks.
- ROG's asset turnover comes in at 0.683 -- ranking 40th of 89 Chemicals stocks.
- TOMZ, AXTA, and WLK are the stocks whose asset turnover ratios are most correlated with ROG.
The table below shows ROG's key quality metrics over time.
Period | Asset Turnover | Gross Margin | ROIC |
---|---|---|---|
2021-06-30 | 0.683 | 0.383 | 0.192 |
2021-03-31 | 0.638 | 0.379 | 0.152 |
2020-12-31 | 0.599 | 0.364 | 0.103 |
2020-09-30 | 0.585 | 0.350 | 0.019 |
2020-06-30 | 0.602 | 0.346 | 0.044 |
2020-03-31 | 0.652 | 0.344 | 0.058 |
ROG Price Target
For more insight on analysts targets of ROG, see our ROG price target page. And for a list of of all stocks sorted by upside potential based on analyst target price, see our Top Price Target page.
Average Price Target | $244.40 | Average Broker Recommendation | 1.2 (Strong Buy) |
ROG Stock Price Chart Interactive Chart >
ROG Price/Volume Stats
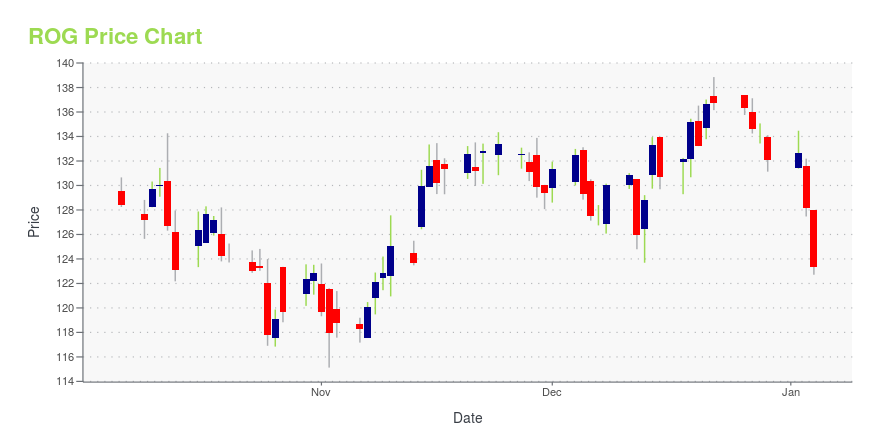
Current price | $259.33 | 52-week high | $274.51 |
Prev. close | $260.50 | 52-week low | $176.00 |
Day low | $259.33 | Volume | 102,200 |
Day high | $261.92 | Avg. volume | 232,022 |
50-day MA | $264.84 | Dividend yield | N/A |
200-day MA | $255.47 | Market Cap | 4.88B |
Rogers Corporation (ROG) Company Bio
Rogers Corporation designs, develops, manufactures, and sells engineered materials and components worldwide. The company was founded in 1832 and is based in Rogers, Connecticut.
Latest ROG News From Around the Web
Below are the latest news stories about Rogers Corp that investors may wish to consider to help them evaluate ROG as an investment opportunity.
Rogers Corp. (ROG) Q4 Earnings Surpass EstimatesRogers Corp. (ROG) delivered earnings and revenue surprises of 16.36% and 3.82%, respectively, for the quarter ended December 2021. Do the numbers hold clues to what lies ahead for the stock? |
Rogers Corporation Reports Fourth Quarter and Full Year 2021 ResultsCHANDLER, Ariz., February 22, 2022--Rogers Corporation (NYSE:ROG) today announced financial results for the full year and fourth quarter of 2021. |
DuPont Rises After $11 Billion Mobility & Materials Segment Sale to CelaneseBy Dhirendra Tripathi |
Rogers Corp. (ROG) to Report Q4 Results: Wall Street Expects Earnings GrowthRogers Corp. (ROG) doesn't possess the right combination of the two key ingredients for a likely earnings beat in its upcoming report. Get prepared with the key expectations. |
Alpine Associates Management Inc. Buys Cerner Corp, Kirkland Lake Gold, Rogers Corp, Sells , ,Englewood Cliffs, NJ, based Investment company Alpine Associates Management Inc. (Current Portfolio) buys Cerner Corp, Kirkland Lake Gold, Rogers Corp, CyrusOne Inc, Arena Pharmaceuticals Inc, sells , , , Five9 Inc, Covanta Holding Corp during the 3-months ended 2021Q4, according to the most recent filings of the investment company, Alpine Associates Management Inc.. |
ROG Price Returns
1-mo | N/A |
3-mo | -4.55% |
6-mo | -5.01% |
1-year | 30.37% |
3-year | 50.27% |
5-year | 138.75% |
YTD | -5.01% |
2021 | 75.80% |
2020 | 24.50% |
2019 | 25.91% |
2018 | -38.82% |
2017 | 110.81% |
Continue Researching ROG
Here are a few links from around the web to help you further your research on Rogers Corp's stock as an investment opportunity:Rogers Corp (ROG) Stock Price | Nasdaq
Rogers Corp (ROG) Stock Quote, History and News - Yahoo Finance
Rogers Corp (ROG) Stock Price and Basic Information | MarketWatch
Loading social stream, please wait...