Retail Opportunity Investments Corp. (ROIC): Price and Financial Metrics
ROIC Price/Volume Stats
Current price | $12.82 | 52-week high | $15.16 |
Prev. close | $12.70 | 52-week low | $10.98 |
Day low | $12.70 | Volume | 938,000 |
Day high | $12.92 | Avg. volume | 1,241,007 |
50-day MA | $13.17 | Dividend yield | 4.87% |
200-day MA | $13.23 | Market Cap | 1.63B |
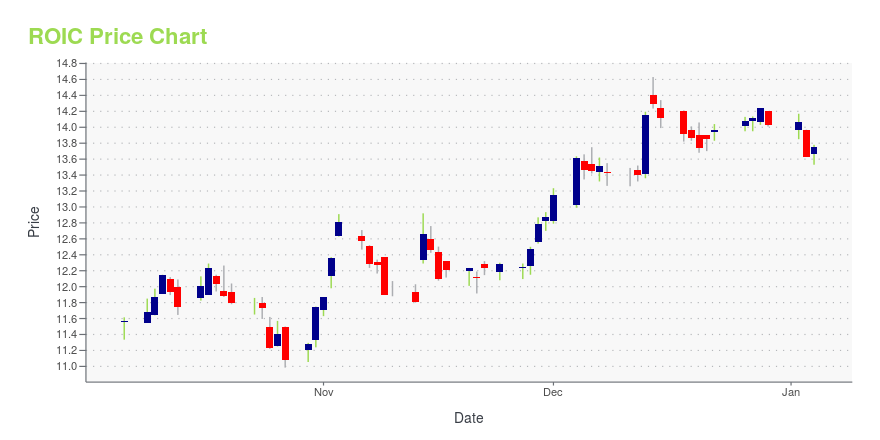
ROIC Stock Price Chart Interactive Chart >
ROIC POWR Grades
- ROIC scores best on the Momentum dimension, with a Momentum rank ahead of 62.22% of US stocks.
- The strongest trend for ROIC is in Stability, which has been heading down over the past 26 weeks.
- ROIC ranks lowest in Sentiment; there it ranks in the 16th percentile.
ROIC Stock Summary
- With a price/earnings ratio of 46.8, RETAIL OPPORTUNITY INVESTMENTS CORP P/E ratio is greater than that of about 85.06% of stocks in our set with positive earnings.
- Of note is the ratio of RETAIL OPPORTUNITY INVESTMENTS CORP's sales and general administrative expense to its total operating expenses; only 6.23% of US stocks have a lower such ratio.
- For ROIC, its debt to operating expenses ratio is greater than that reported by 94.17% of US equities we're observing.
- If you're looking for stocks that are quantitatively similar to RETAIL OPPORTUNITY INVESTMENTS CORP, a group of peers worth examining would be LTC, UE, DEI, ENLC, and IPG.
- Visit ROIC's SEC page to see the company's official filings. To visit the company's web site, go to www.roireit.net.
ROIC Valuation Summary
- ROIC's EV/EBIT ratio is 29.6; this is 0% higher than that of the median Real Estate stock.
- ROIC's price/sales ratio has moved NA NA over the prior 172 months.
Below are key valuation metrics over time for ROIC.
Stock | Date | P/S | P/B | P/E | EV/EBIT |
---|---|---|---|---|---|
ROIC | 2023-12-29 | 5.5 | 1.4 | 48.2 | 29.6 |
ROIC | 2023-12-28 | 5.6 | 1.4 | 48.9 | 29.8 |
ROIC | 2023-12-27 | 5.5 | 1.4 | 48.4 | 29.7 |
ROIC | 2023-12-26 | 5.5 | 1.4 | 48.3 | 29.6 |
ROIC | 2023-12-22 | 5.4 | 1.4 | 48.0 | 29.5 |
ROIC | 2023-12-21 | 5.4 | 1.4 | 47.6 | 29.3 |
ROIC Growth Metrics
- The 2 year cash and equivalents growth rate now stands at -67.11%.
- Its 2 year net income to common stockholders growth rate is now at 21.3%.
- Its 4 year price growth rate is now at -62.54%.
The table below shows ROIC's growth in key financial areas (numbers in millions of US dollars).
Date | Revenue | Operating Cash Flow | Net Income to Common Stock |
---|---|---|---|
2022-09-30 | 305.534 | 154.209 | 50.184 |
2022-06-30 | 298.881 | 147.072 | 52.757 |
2022-03-31 | 291.386 | 140.553 | 57.734 |
2021-12-31 | 284.1 | 136.332 | 53.508 |
2021-09-30 | 284.22 | 128.898 | 53.893 |
2021-06-30 | 282.607 | 124.434 | 39.264 |
ROIC's Quality Factors
The “Quality” component of the POWR Ratings focuses on 31 different factors of a companies fundamentals and operational strength. Here are some key insights as we drill into the specifics of these quality attributes.- ROIC has a Quality Grade of C, ranking ahead of 57.12% of graded US stocks.
- ROIC's asset turnover comes in at 0.099 -- ranking 217th of 444 Trading stocks.
- PGRE, AKR, and CPT are the stocks whose asset turnover ratios are most correlated with ROIC.
The table below shows ROIC's key quality metrics over time.
Period | Asset Turnover | Gross Margin | ROIC |
---|---|---|---|
2021-09-30 | 0.099 | 0.730 | 0.027 |
2021-06-30 | 0.098 | 0.731 | 0.024 |
2021-03-31 | 0.096 | 0.731 | 0.021 |
2020-12-31 | 0.096 | 0.738 | 0.021 |
2020-09-30 | 0.096 | 0.738 | 0.022 |
2020-06-30 | 0.097 | 0.740 | 0.024 |
ROIC Price Target
For more insight on analysts targets of ROIC, see our ROIC price target page. And for a list of of all stocks sorted by upside potential based on analyst target price, see our Top Price Target page.
Average Price Target | $19.35 | Average Broker Recommendation | 1.64 (Moderate Buy) |
Retail Opportunity Investments Corp. (ROIC) Company Bio
Retail Opportunity Investments Corporation engages in the acquisition, ownership, and management of necessity-based community and neighborhood shopping centers in the eastern and western regions of the United States. The company was founded in 2009 and is based in San Diego, California.
Latest ROIC News From Around the Web
Below are the latest news stories about RETAIL OPPORTUNITY INVESTMENTS CORP that investors may wish to consider to help them evaluate ROIC as an investment opportunity.
Retail Opportunity Investments Corp. (NASDAQ:ROIC) Q3 2023 Earnings Call TranscriptRetail Opportunity Investments Corp. (NASDAQ:ROIC) Q3 2023 Earnings Call Transcript October 25, 2023 Retail Opportunity Investments Corp. misses on earnings expectations. Reported EPS is $0.06329 EPS, expectations were $0.27. Operator: Welcome to the Retail Opportunity Investments Third Quarter 2023 Conference Call. Participants are currently in a listen-only mode. Following the company’s prepared remarks, the call […] |
Q3 2023 Retail Opportunity Investments Corp Earnings CallQ3 2023 Retail Opportunity Investments Corp Earnings Call |
Retail Opportunity Investments Corp (ROIC) Reports Strong Q3 2023 ResultsROIC's Q3 2023 Earnings Highlight Solid Performance and Leasing Momentum |
Retail Opportunity Investments (ROIC) Matches Q3 FFO EstimatesRetail Opportunity Investments (ROIC) delivered FFO and revenue surprises of 0% and 0.49%, respectively, for the quarter ended September 2023. Do the numbers hold clues to what lies ahead for the stock? |
Retail Opportunity Investments Corp. Reports 2023 Third Quarter ResultsSAN DIEGO, Oct. 24, 2023 (GLOBE NEWSWIRE) -- Retail Opportunity Investments Corp. (NASDAQ:ROIC) announced today financial and operating results for the three and nine months ended September 30, 2023. HIGHLIGHTS $8.4 million of net income attributable to common stockholders ($0.07 per diluted share)$36.0 million in Funds From Operations (FFO)(1) ($0.27 per diluted share)FFO per diluted share guidance for 2023 narrowed ($1.05 - $1.07 per diluted share)8.2% increase in same-center cash net operatin |
ROIC Price Returns
1-mo | 0.78% |
3-mo | -7.55% |
6-mo | 5.89% |
1-year | -0.35% |
3-year | -11.88% |
5-year | -12.43% |
YTD | -7.55% |
2023 | -2.43% |
2022 | -20.65% |
2021 | 50.64% |
2020 | -22.90% |
2019 | 16.36% |
ROIC Dividends
Ex-Dividend Date | Type | Payout Amount | Change | ||||||
---|---|---|---|---|---|---|---|---|---|
Loading, please wait... |
Continue Researching ROIC
Want to see what other sources are saying about Retail Opportunity Investments Corp's financials and stock price? Try the links below:Retail Opportunity Investments Corp (ROIC) Stock Price | Nasdaq
Retail Opportunity Investments Corp (ROIC) Stock Quote, History and News - Yahoo Finance
Retail Opportunity Investments Corp (ROIC) Stock Price and Basic Information | MarketWatch
Loading social stream, please wait...