Ross Stores, Inc. (ROST): Price and Financial Metrics
ROST Price/Volume Stats
Current price | $146.76 | 52-week high | $151.12 |
Prev. close | $147.19 | 52-week low | $99.00 |
Day low | $146.45 | Volume | 1,960,003 |
Day high | $148.10 | Avg. volume | 1,978,723 |
50-day MA | $144.86 | Dividend yield | 1.02% |
200-day MA | $126.08 | Market Cap | 49.41B |
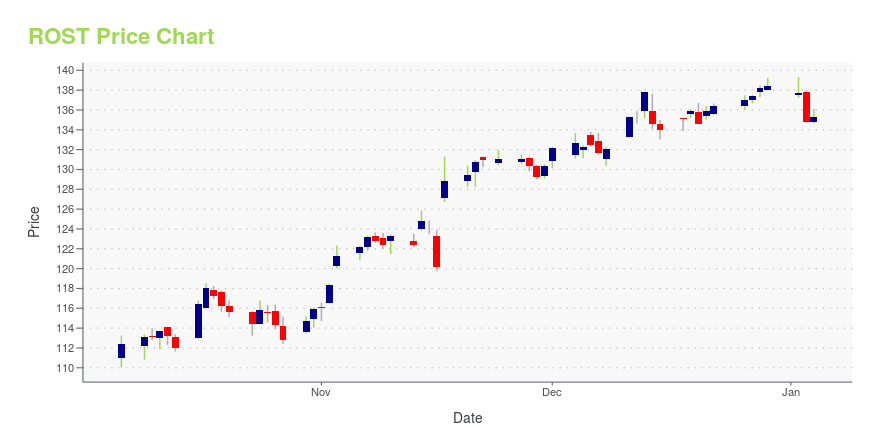
ROST Stock Price Chart Interactive Chart >
ROST POWR Grades
- Quality is the dimension where ROST ranks best; there it ranks ahead of 87.04% of US stocks.
- ROST's strongest trending metric is Value; it's been moving down over the last 26 weeks.
- ROST's current lowest rank is in the Value metric (where it is better than 26% of US stocks).
ROST Stock Summary
- ROSS STORES INC's market capitalization of $45,372,512,669 is ahead of 94.34% of US-listed equities.
- The capital turnover (annual revenue relative to shareholder's equity) for ROST is 4.27 -- better than 88.38% of US stocks.
- ROST's went public 37.52 years ago, making it older than 92.45% of listed US stocks we're tracking.
- Stocks that are quantitatively similar to ROST, based on their financial statements, market capitalization, and price volatility, are PAYX, GWW, HSY, TT, and CRH.
- ROST's SEC filings can be seen here. And to visit ROSS STORES INC's official web site, go to www.rossstores.com.
ROST Valuation Summary
- In comparison to the median Consumer Cyclical stock, ROST's price/sales ratio is 20% higher, now standing at 2.4.
- Over the past 243 months, ROST's price/sales ratio has gone up 1.3.
Below are key valuation metrics over time for ROST.
Stock | Date | P/S | P/B | P/E | EV/EBIT |
---|---|---|---|---|---|
ROST | 2023-12-29 | 2.4 | 10.2 | 27.2 | 22.6 |
ROST | 2023-12-28 | 2.4 | 10.2 | 27.2 | 22.5 |
ROST | 2023-12-27 | 2.4 | 10.1 | 27.0 | 22.4 |
ROST | 2023-12-26 | 2.4 | 10.1 | 26.9 | 22.3 |
ROST | 2023-12-22 | 2.3 | 10.0 | 26.8 | 22.2 |
ROST | 2023-12-21 | 2.3 | 10.0 | 26.7 | 22.2 |
ROST Growth Metrics
- The 3 year net income to common stockholders growth rate now stands at -0.36%.
- The 2 year cash and equivalents growth rate now stands at 50.42%.
- The 5 year cash and equivalents growth rate now stands at 114.56%.
The table below shows ROST's growth in key financial areas (numbers in millions of US dollars).
Date | Revenue | Operating Cash Flow | Net Income to Common Stock |
---|---|---|---|
2022-09-30 | 18,502.25 | 707.863 | 1,431.82 |
2022-06-30 | 18,511.3 | 337.189 | 1,474.814 |
2022-03-31 | 18,733.26 | 569.762 | 1,584.555 |
2021-12-31 | 18,916.24 | 1,738.849 | 1,722.589 |
2021-09-30 | 18,145.27 | 1,966.463 | 1,593.747 |
2021-06-30 | 17,325.23 | 3,418.907 | 1,339.914 |
ROST's Quality Factors
The “Quality” component of the POWR Ratings focuses on 31 different factors of a companies fundamentals and operational strength. Here are some key insights as we drill into the specifics of these quality attributes.- ROST has a Quality Grade of A, ranking ahead of 95.71% of graded US stocks.
- ROST's asset turnover comes in at 1.324 -- ranking 97th of 165 Retail stocks.
- TJX, BURL, and JWN are the stocks whose asset turnover ratios are most correlated with ROST.
The table below shows ROST's key quality metrics over time.
Period | Asset Turnover | Gross Margin | ROIC |
---|---|---|---|
2021-07-31 | 1.324 | 0.280 | 0.197 |
2021-05-01 | 1.216 | 0.267 | 0.131 |
2021-01-30 | 1.059 | 0.215 | 0.018 |
2020-10-31 | 1.155 | 0.220 | 0.035 |
2020-08-01 | 1.253 | 0.221 | 0.068 |
2020-05-02 | 1.458 | 0.239 | 0.121 |
ROST Price Target
For more insight on analysts targets of ROST, see our ROST price target page. And for a list of of all stocks sorted by upside potential based on analyst target price, see our Top Price Target page.
Average Price Target | $140.47 | Average Broker Recommendation | 1.5 (Moderate Buy) |
Ross Stores, Inc. (ROST) Company Bio
Ross Stores, Inc., operating under the brand name Ross Dress for Less, is an American chain of discount department stores headquartered in Dublin, California. It is the largest off-price retailer in the U.S.; as of 2018, Ross operates 1,483 stores in 37 U.S. states, the District of Columbia and Guam, covering much of the country, but with no presence in New England, New York, northern New Jersey, Alaska and areas of the Midwest. (Source:Wikipedia)
Latest ROST News From Around the Web
Below are the latest news stories about ROSS STORES INC that investors may wish to consider to help them evaluate ROST as an investment opportunity.
Stocks, sectors that reached record highs in 20232023 — and the month of December — has been a year for record gains across various sectors and stocks, such as homebuilders and tech companies. Yahoo Finance's Jared Blikre highlights several stocks and industries that have reached new highs year-to-date. For more expert insight and the latest market action, click here to watch this full episode of Yahoo Finance Live. |
CRWD Stock Among 28 Stocks To Buy And Watch Heading Into 2024Featuring MDB, PANW and CRWD stock, this stock screener highlights top-rated companies to watch in 2024 and beyond. |
Why Walmart, Burlington, and TJX Customers Are Flashing Warning Signs for the 2024 EconomyIf you want to know what's going on in the economy, you might want to take a look at what discount retailers are saying. |
Ross Stores (ROST) Fared Better in Q3TimesSquare Capital Management, an equity investment management company, released its “U.S. Mid Cap Growth Strategy” third-quarter investor letter. A copy of the same can be downloaded here. In the third quarter, the strategy outperformed the Russell Midcap Growth Index and returned -4.11% (net) while the index return was -5.22%. The third quarter saw a decline in […] |
Here's Why Ross Stores (ROST) is a Strong Momentum StockWhether you're a value, growth, or momentum investor, finding strong stocks becomes easier with the Zacks Style Scores, a top feature of the Zacks Premium research service. |
ROST Price Returns
1-mo | -1.67% |
3-mo | 6.31% |
6-mo | 30.59% |
1-year | 44.81% |
3-year | 26.64% |
5-year | 65.33% |
YTD | 6.31% |
2023 | 20.64% |
2022 | 2.94% |
2021 | -6.03% |
2020 | 5.81% |
2019 | 41.34% |
ROST Dividends
Ex-Dividend Date | Type | Payout Amount | Change | ||||||
---|---|---|---|---|---|---|---|---|---|
Loading, please wait... |
Continue Researching ROST
Want to see what other sources are saying about Ross Stores Inc's financials and stock price? Try the links below:Ross Stores Inc (ROST) Stock Price | Nasdaq
Ross Stores Inc (ROST) Stock Quote, History and News - Yahoo Finance
Ross Stores Inc (ROST) Stock Price and Basic Information | MarketWatch
Loading social stream, please wait...