
Red River Bancshares, Inc. (RRBI): Price and Financial Metrics
RRBI Price/Volume Stats
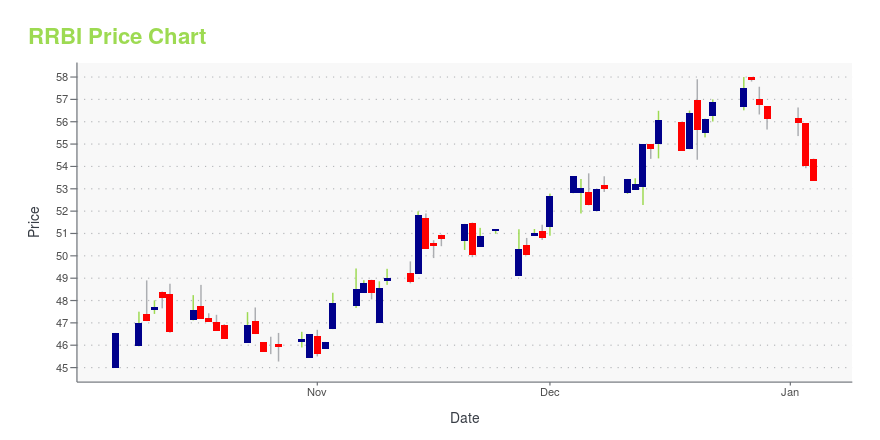
| Current price | $55.40 | 52-week high | $58.00 |
| Prev. close | $55.39 | 52-week low | $42.78 |
| Day low | $54.71 | Volume | 11,168 |
| Day high | $55.89 | Avg. volume | 9,481 |
| 50-day MA | $48.15 | Dividend yield | 0.65% |
| 200-day MA | $49.56 | Market Cap | 382.43M |
RRBI Stock Price Chart Interactive Chart >
Red River Bancshares, Inc. (RRBI) Company Bio
Red River Bancshares, Inc. is a holding company which carries out its operations through its subsidiary, Red River Bank. It provides banking products and services for commercial and retail customers. Its commercial banking products and services include real estate and commercial loans, and treasury management services. The personal banking aspect of the firm deals with retail banking networks, private banking services, residential mortgage lending, and investment services. The company was founded on March 16, 1998 and is headquartered in Alexandria, LA.
Latest RRBI News From Around the Web
Below are the latest news stories about RED RIVER BANCSHARES INC that investors may wish to consider to help them evaluate RRBI as an investment opportunity.
Red River Bancshares, Inc. Announces Renewal of Stock Repurchase ProgramALEXANDRIA, La., Dec. 14, 2023 (GLOBE NEWSWIRE) -- Red River Bancshares, Inc. (Nasdaq: RRBI) (the “Company”) announced today that its board of directors approved the renewal of its stock repurchase program. The current program was scheduled to expire on December 31, 2023 or the purchase of the full $5.0 million authorized thereunder, which occurred on December 8, 2023. The renewed repurchase program authorizes the Company to purchase up to $5.0 million of its outstanding shares of common stock f |
While insiders own 33% of Red River Bancshares, Inc. (NASDAQ:RRBI), retail investors are its largest shareholders with 46% ownershipKey Insights Significant control over Red River Bancshares by retail investors implies that the general public has more... |
Red River Bancshares Inc (RRBI) Reports Q3 2023 Earnings: Net Income Down by 10.6%RRBI's Q3 2023 earnings reveal a decrease in net income and EPS, despite higher deposits and assets |
Red River Bancshares (RRBI) Q3 Earnings and Revenues Lag EstimatesRed River Bancshares (RRBI) delivered earnings and revenue surprises of -9.68% and 4.45%, respectively, for the quarter ended September 2023. Do the numbers hold clues to what lies ahead for the stock? |
Red River Bancshares, Inc. Reports Third Quarter 2023 Financial ResultsALEXANDRIA, La., Oct. 30, 2023 (GLOBE NEWSWIRE) -- Red River Bancshares, Inc. (the “Company”) (Nasdaq: RRBI), the holding company for Red River Bank (the “Bank”), announced today its unaudited financial results for the third quarter of 2023. Net income for the third quarter of 2023 was $8.0 million, or $1.12 per diluted common share (“EPS”), a decrease of $947,000, or 10.6%, compared to $9.0 million, or $1.25 EPS, for the second quarter of 2023. For the third quarter of 2023, the quarterly retur |
RRBI Price Returns
| 1-mo | 16.05% |
| 3-mo | 17.58% |
| 6-mo | 7.19% |
| 1-year | 11.54% |
| 3-year | 10.66% |
| 5-year | 19.99% |
| YTD | -0.89% |
| 2023 | 10.59% |
| 2022 | -4.04% |
| 2021 | 8.53% |
| 2020 | -11.12% |
| 2019 | N/A |
RRBI Dividends
| Ex-Dividend Date | Type | Payout Amount | Change | ||||||
|---|---|---|---|---|---|---|---|---|---|
| Loading, please wait... | |||||||||
Loading social stream, please wait...