Range Resources Corporation (RRC): Price and Financial Metrics
GET POWR RATINGS... FREE!
RRC POWR Grades
- RRC scores best on the Momentum dimension, with a Momentum rank ahead of 96.89% of US stocks.
- RRC's strongest trending metric is Growth; it's been moving down over the last 177 days.
- RRC's current lowest rank is in the Sentiment metric (where it is better than 4.97% of US stocks).
RRC Stock Summary
- With a price/earnings ratio of 4.84, RANGE RESOURCES CORP P/E ratio is greater than that of about only 9.43% of stocks in our set with positive earnings.
- In terms of twelve month growth in earnings before interest and taxes, RANGE RESOURCES CORP is reporting a growth rate of -714.59%; that's higher than only 2.44% of US stocks.
- Revenue growth over the past 12 months for RANGE RESOURCES CORP comes in at 108.09%, a number that bests 92.3% of the US stocks we're tracking.
- Stocks with similar financial metrics, market capitalization, and price volatility to RANGE RESOURCES CORP are TRNO, PDS, HT, MARA, and IPG.
- Visit RRC's SEC page to see the company's official filings. To visit the company's web site, go to www.rangeresources.com.
RRC Valuation Summary
- In comparison to the median Energy stock, RRC's EV/EBIT ratio is 45.81% lower, now standing at 5.5.
- Over the past 243 months, RRC's price/sales ratio has gone down 0.2.
Below are key valuation metrics over time for RRC.
Stock | Date | P/S | P/B | P/E | EV/EBIT |
---|---|---|---|---|---|
RRC | 2023-01-13 | 1.5 | 2.8 | 4.8 | 5.5 |
RRC | 2023-01-12 | 1.5 | 2.9 | 4.9 | 5.6 |
RRC | 2023-01-11 | 1.5 | 2.8 | 4.7 | 5.4 |
RRC | 2023-01-10 | 1.4 | 2.7 | 4.7 | 5.4 |
RRC | 2023-01-09 | 1.5 | 2.7 | 4.7 | 5.4 |
RRC | 2023-01-06 | 1.4 | 2.7 | 4.6 | 5.3 |
RRC Growth Metrics
- Its 2 year cash and equivalents growth rate is now at 21288.45%.
- Its year over year net income to common stockholders growth rate is now at 91.3%.
- The 4 year net cashflow from operations growth rate now stands at 3.83%.

The table below shows RRC's growth in key financial areas (numbers in millions of US dollars).
Date | Revenue | Operating Cash Flow | Net Income to Common Stock |
---|---|---|---|
2022-09-30 | 4,083.254 | 1,569.748 | 1,260.5 |
2022-06-30 | 3,275.348 | 1,240.633 | 537.146 |
2022-03-31 | 2,484.927 | 1,090.11 | -72.181 |
2021-12-31 | 2,930.223 | 792.948 | 411.778 |
2021-09-30 | 1,962.279 | 564.995 | -509.723 |
2021-06-30 | 1,958.985 | 348.847 | -839.504 |
RRC's Quality Factors
The “Quality” component of the POWR Ratings focuses on 31 different factors of a companies fundamentals and operational strength. Here are some key insights as we drill into the specifics of these quality attributes.- RRC has a Quality Grade of C, ranking ahead of 48.33% of graded US stocks.
- RRC's asset turnover comes in at 0.316 -- ranking 80th of 136 Petroleum and Natural Gas stocks.
- KEGX, XPRO, and ROYL are the stocks whose asset turnover ratios are most correlated with RRC.
The table below shows RRC's key quality metrics over time.
Period | Asset Turnover | Gross Margin | ROIC |
---|---|---|---|
2021-09-30 | 0.316 | 0.223 | -0.030 |
2021-06-30 | 0.319 | 0.266 | -0.078 |
2021-03-31 | 0.307 | 0.261 | -0.080 |
2020-12-31 | 0.313 | 0.292 | -0.061 |
2020-09-30 | 0.308 | 0.273 | -0.319 |
2020-06-30 | 0.323 | 0.342 | -0.223 |
RRC Price Target
For more insight on analysts targets of RRC, see our RRC price target page. And for a list of of all stocks sorted by upside potential based on analyst target price, see our Top Price Target page.
Average Price Target | $17.56 | Average Broker Recommendation | 1.81 (Hold) |
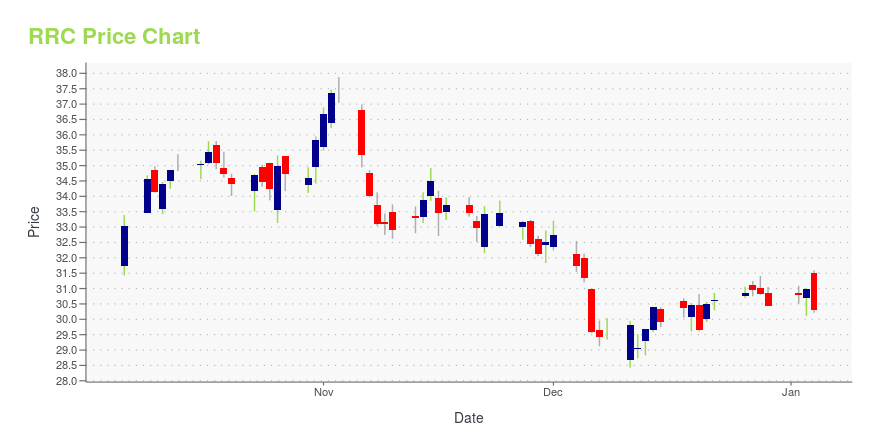
RRC Stock Price Chart Interactive Chart >
RRC Price/Volume Stats
Current price | $25.29 | 52-week high | $37.44 |
Prev. close | $25.26 | 52-week low | $18.62 |
Day low | $25.02 | Volume | 2,608,900 |
Day high | $25.65 | Avg. volume | 4,084,450 |
50-day MA | $26.30 | Dividend yield | 1.27% |
200-day MA | $28.95 | Market Cap | 6.11B |
Range Resources Corporation (RRC) Company Bio
Range Resources is an oil and natural gas producer with operations focused in Appalachia and the Midcontinent region of the United States. The company was founded in 1975 and is based in Fort Worth, Texas.
Latest RRC News From Around the Web
Below are the latest news stories about RANGE RESOURCES CORP that investors may wish to consider to help them evaluate RRC as an investment opportunity.
Boasting A 58% Return On Equity, Is Range Resources Corporation (NYSE:RRC) A Top Quality Stock?While some investors are already well versed in financial metrics (hat tip), this article is for those who would like... |
Warm Weather Sends Some of 2022's Hottest Stocks SouthUnseasonably warm weather is snuffing out the rally in natural-gas stocks, which were some of the market's top performers over the past two years. Shares of EQT, which is the country's largest gas producer, logged annual gains of 72% and 55% in 2021 and 2022, respectively, while Antero Resources tripled in 2021 and rose another 77% last year. They and rivals have started this year headed the other way now that it looks like the northern hemisphere will have plenty of natural gas to get through w |
Do Options Traders Know Something About Range Resources (RRC) Stock We Don't?Investors need to pay close attention to Range Resources (RRC) stock based on the movements in the options market lately. |
These 2 Class of ’22 Outperformers Have Plenty of Room to Run, Says Top AnalystNo matter how you slice it, 2022 has not been a good year for the stock markets – and the year ahead isn’t looking so great, either. Headwinds that are sure to buffet the markets with varying strength over the coming months include persistently high inflation, continued rate hikes from the Federal Reserve, and the ongoing war in Ukraine. These may be partially offset by a gradual reopening of the Chinese economy, as Beijing pulls back from its zero-COVID policies. Uncertainty is the only constan |
Here's Why Retain Strategy is Apt for Range Resources (RRC) NowThe higher natural gas price is aiding Range Resources' (RRC) bottom line. |
RRC Price Returns
1-mo | 1.08% |
3-mo | -10.18% |
6-mo | -19.96% |
1-year | 30.88% |
3-year | 747.66% |
5-year | 81.96% |
YTD | 1.08% |
2022 | 41.10% |
2021 | 166.12% |
2020 | 38.14% |
2019 | -48.60% |
2018 | -43.60% |
RRC Dividends
Ex-Dividend Date | Type | Payout Amount | Change | ||||||
---|---|---|---|---|---|---|---|---|---|
Loading, please wait... |
Continue Researching RRC
Here are a few links from around the web to help you further your research on Range Resources Corp's stock as an investment opportunity:Range Resources Corp (RRC) Stock Price | Nasdaq
Range Resources Corp (RRC) Stock Quote, History and News - Yahoo Finance
Range Resources Corp (RRC) Stock Price and Basic Information | MarketWatch
Loading social stream, please wait...