
Regal Rexnord Corp. (RRX): Price and Financial Metrics
RRX Price/Volume Stats
| Current price | $155.49 | 52-week high | $183.85 |
| Prev. close | $150.91 | 52-week low | $97.18 |
| Day low | $153.15 | Volume | 448,568 |
| Day high | $156.79 | Avg. volume | 448,959 |
| 50-day MA | $145.30 | Dividend yield | 0.92% |
| 200-day MA | $145.87 | Market Cap | 10.34B |
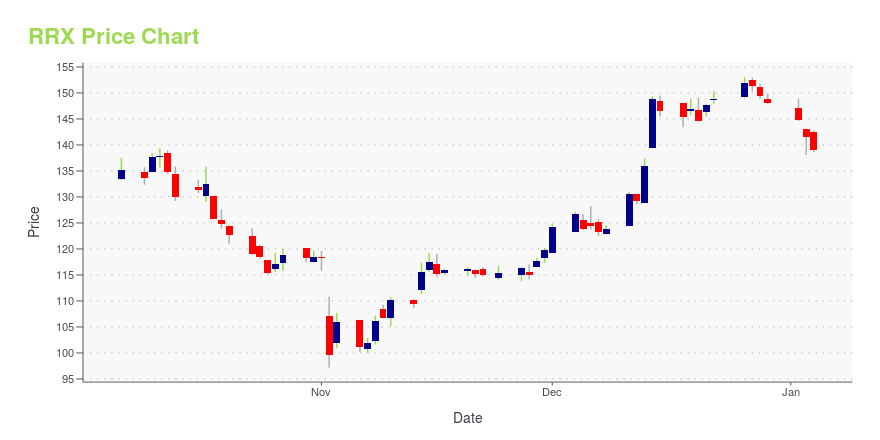
RRX Stock Price Chart Interactive Chart >
Regal Rexnord Corp. (RRX) Company Bio
Regal Rexnord Corp. engages in the manufacture of electric motors, electrical motion controls, power generation, and power transmission products. It operates through the following segments: Commercial Systems, Industrial Systems, Climate Solutions, and Power Transmission Solutions. The Commercial Systems segment produces fractional to 5 horsepower AC and DC motors, electric variable speed controls, fans, and blowers for commercial applications. The Industrial Systems segment produces integral motors, generators, alternators and switchgear for industrial applications. The Climate Solutions segment offers small motors, controls, and air moving solutions serving markets including residential and light commercial HVAC, water heaters and commercial refrigeration. The Power Transmission Solutions segment manufactures, sells, and services belt and chain drives, helical and worm gearing, mounted and unmounted bearings, couplings, modular plastic belts, conveying chains and components, hydraulic pump drives, large open gearing, and specialty mechanical products serving markets including beverage, bulk handling, metals, special machinery, energy, aerospace, and general industrial. The company was founded in 1955 and is headquartered in Beloit, WI.
Latest RRX News From Around the Web
Below are the latest news stories about REGAL REXNORD CORP that investors may wish to consider to help them evaluate RRX as an investment opportunity.
RBC Bearings (RBC) Rose on Strong Margin PerformanceClearBridge Investments, an investment management firm, released its third-quarter 2023 “Mid Cap Growth Strategy” investor letter, a copy of which can be downloaded here. The strategy underperformed its benchmark Russell Midcap Growth Index in the quarter. Overall, the effects of stock selection impacted the performance on a relative basis. The strategy gained three of the 11 […] |
Insider Sell Alert: President and CEO Michael Hartnett Sells 14,774 Shares of RBC Bearings Inc (RBC)Michael Hartnett, the President and CEO of RBC Bearings Incorporated, has recently made a significant change to his holdings in the company. |
Insider Sell Alert: President and CEO Michael Hartnett Sells 47,626 Shares of RBC Bearings Inc (RBC)Michael Hartnett, the President and CEO of RBC Bearings Incorporated, has recently made a significant change to his holdings in the company. |
Reasons to Retain RBC Bearings (RBC) Stock in Your PortfolioStrength in the food and beverage, mining, energy and general industrial end markets poises RBC Bearings (RBC) well for growth. The company's measures to reward its shareholders are promising. |
Regal Rexnord Corporation Announces Publication Of Annual Sustainability ReportRegal Rexnord Corporation (NYSE: RRX) today published its annual Sustainability Report. The report reaffirms critical elements of the Company's growth strategy, and provides an update on how it is executing them: |
RRX Price Returns
| 1-mo | 13.93% |
| 3-mo | -5.01% |
| 6-mo | 14.12% |
| 1-year | 3.76% |
| 3-year | 24.74% |
| 5-year | 113.38% |
| YTD | 5.52% |
| 2023 | 24.56% |
| 2022 | -28.75% |
| 2021 | 46.24% |
| 2020 | 45.52% |
| 2019 | 24.03% |
RRX Dividends
| Ex-Dividend Date | Type | Payout Amount | Change | ||||||
|---|---|---|---|---|---|---|---|---|---|
| Loading, please wait... | |||||||||
Loading social stream, please wait...