SunRun Inc. (RUN): Price and Financial Metrics
RUN Price/Volume Stats
Current price | $12.14 | 52-week high | $33.33 |
Prev. close | $12.56 | 52-week low | $11.50 |
Day low | $12.05 | Volume | 1,114,030 |
Day high | $12.49 | Avg. volume | 9,065,300 |
50-day MA | $15.49 | Dividend yield | N/A |
200-day MA | $19.84 | Market Cap | 2.64B |
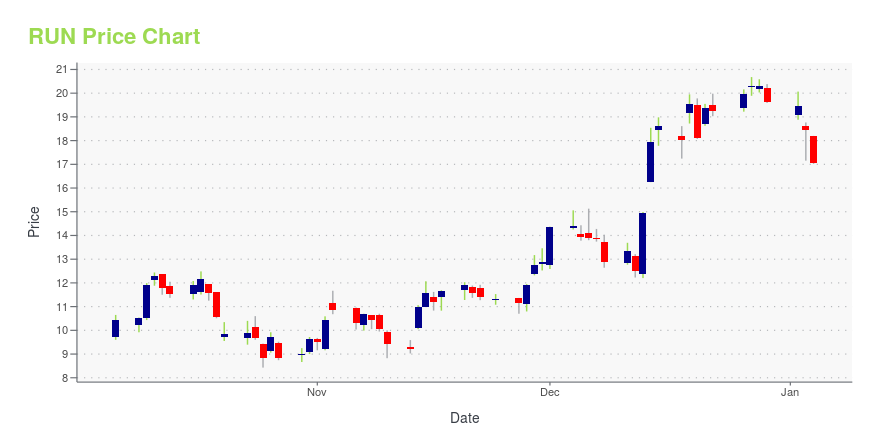
RUN Stock Price Chart Interactive Chart >
RUN POWR Grades
- RUN scores best on the Momentum dimension, with a Momentum rank ahead of 44.28% of US stocks.
- The strongest trend for RUN is in Momentum, which has been heading down over the past 177 days.
- RUN's current lowest rank is in the Quality metric (where it is better than 0.81% of US stocks).
RUN Stock Summary
- The ratio of debt to operating expenses for SUNRUN INC is higher than it is for about 91.8% of US stocks.
- In terms of twelve month growth in earnings before interest and taxes, SUNRUN INC is reporting a growth rate of 101.86%; that's higher than 88.23% of US stocks.
- SUNRUN INC's shareholder yield -- a measure of how much capital is returned to stockholders via dividends and buybacks -- is -72.89%, greater than the shareholder yield of just 8.01% of stocks in our set.
- Stocks with similar financial metrics, market capitalization, and price volatility to SUNRUN INC are CACC, TROX, SABR, ASPS, and ALCO.
- RUN's SEC filings can be seen here. And to visit SUNRUN INC's official web site, go to www.sunrun.com.
RUN Valuation Summary
- In comparison to the median Technology stock, RUN's price/earnings ratio is 23.44% higher, now standing at 31.6.
- Over the past 99 months, RUN's EV/EBIT ratio has gone up 69.1.
Below are key valuation metrics over time for RUN.
Stock | Date | P/S | P/B | P/E | EV/EBIT |
---|---|---|---|---|---|
RUN | 2023-09-22 | 1.2 | 0.4 | 31.6 | 19.7 |
RUN | 2023-09-21 | 1.2 | 0.4 | 33.1 | 20.0 |
RUN | 2023-09-20 | 1.3 | 0.5 | 34.9 | 20.2 |
RUN | 2023-09-19 | 1.3 | 0.5 | 35.3 | 20.3 |
RUN | 2023-09-18 | 1.3 | 0.5 | 34.5 | 20.2 |
RUN | 2023-09-15 | 1.4 | 0.5 | 36.9 | 20.5 |
RUN Growth Metrics
- Its year over year net income to common stockholders growth rate is now at 15.25%.
- Its 2 year net cashflow from operations growth rate is now at -166.82%.
- Its 5 year net income to common stockholders growth rate is now at -86.59%.

The table below shows RUN's growth in key financial areas (numbers in millions of US dollars).
Date | Revenue | Operating Cash Flow | Net Income to Common Stock |
---|---|---|---|
2022-09-30 | 2,147.499 | -825.477 | 71.837 |
2022-06-30 | 1,954.358 | -915.683 | -114.594 |
2022-03-31 | 1,770.944 | -887.948 | -143.412 |
2021-12-31 | 1,609.954 | -817.186 | -79.423 |
2021-09-30 | 1,495.131 | -687.042 | -210.224 |
2021-06-30 | 1,266.126 | -521.483 | -196.906 |
RUN's Quality Factors
The “Quality” component of the POWR Ratings focuses on 31 different factors of a companies fundamentals and operational strength. Here are some key insights as we drill into the specifics of these quality attributes.- RUN has a Quality Grade of F, ranking ahead of 0.72% of graded US stocks.
- RUN's asset turnover comes in at 0.098 -- ranking 59th of 60 Construction Materials stocks.
- PRLB, OFLX, and CVCO are the stocks whose asset turnover ratios are most correlated with RUN.
The table below shows RUN's key quality metrics over time.
Period | Asset Turnover | Gross Margin | ROIC |
---|---|---|---|
2021-09-30 | 0.098 | 0.168 | 0.004 |
2021-06-30 | 0.099 | 0.171 | 0.000 |
2021-03-31 | 0.101 | 0.170 | 0.001 |
2020-12-31 | 0.113 | 0.194 | 0.000 |
2020-09-30 | 0.141 | 0.229 | 0.022 |
2020-06-30 | 0.147 | 0.227 | 0.025 |
RUN Price Target
For more insight on analysts targets of RUN, see our RUN price target page. And for a list of of all stocks sorted by upside potential based on analyst target price, see our Top Price Target page.
Average Price Target | $76.47 | Average Broker Recommendation | 1.48 (Moderate Buy) |
SunRun Inc. (RUN) Company Bio
Sunrun develops, owns, manages, and sells residential solar energy systems. It distributes solar energy products and material used in the design, installation, and maintenance of solar energy systems. The company was founded in 2007 and is based in San Francisco, California.
Latest RUN News From Around the Web
Below are the latest news stories about SUNRUN INC that investors may wish to consider to help them evaluate RUN as an investment opportunity.
Decoding Sunrun Inc (RUN)'s Performance Potential: A Deep Dive into Key MetricsUnraveling the Factors That Could Limit Sunrun Inc's Future Growth |
Is Sunrun (RUN) Too Good to Be True? A Comprehensive Analysis of a Potential Value TrapUnpacking the Risks and Rewards of Investing in Sunrun (RUN) |
Sunrun Closes $715 million Senior Securitization of Residential Solar & Battery Systems and Raises $253 million of Additional Subordinated FinancingSAN FRANCISCO, Sept. 28, 2023 (GLOBE NEWSWIRE) -- Sunrun (Nasdaq: RUN), the nation’s leading provider of residential solar, storage and energy services, today announced it has closed the securitization of leases and power purchase agreements, known as Sunrun’s solar-as-a-service offering, and raised additional subordinated non-recourse financing. "We are pleased with Sunrun's record-setting transaction, placing the largest ever residential solar securitization for the industry and subsequently r |
Sunrun Expands Leadership Team to Enhance Customer Experience Throughout the Entire Customer Lifecycle, Accelerate Innovation and Drive EfficienciesSunrun reaffirms commitment to creating a personalized, multi-decade energy experience and increasing customer value with appointments of Dr. Marcus Mueller and Rachit SrivastavaSAN FRANCISCO, Sept. 26, 2023 (GLOBE NEWSWIRE) -- Sunrun (Nasdaq: RUN), the nation’s leading provider of residential solar, battery storage and energy services, has appointed Dr. Marcus Mueller as Vice President of Generation and Rachit Srivastava as Head of Artificial Intelligence (AI). Marcus joins Sunrun after serving |
Beware! 7 Energy Stocks Waving Massive Red Flags Right NowNavigate the energy quagmire knowing which energy stocks to sell at this time to marginalize your portfolio risk |
RUN Price Returns
1-mo | -23.21% |
3-mo | N/A |
6-mo | -36.14% |
1-year | -56.00% |
3-year | -84.12% |
5-year | -5.53% |
YTD | -49.46% |
2022 | -29.97% |
2021 | -50.56% |
2020 | 402.39% |
2019 | 26.81% |
2018 | 84.58% |
Continue Researching RUN
Here are a few links from around the web to help you further your research on Sunrun Inc's stock as an investment opportunity:Sunrun Inc (RUN) Stock Price | Nasdaq
Sunrun Inc (RUN) Stock Quote, History and News - Yahoo Finance
Sunrun Inc (RUN) Stock Price and Basic Information | MarketWatch
Loading social stream, please wait...