
Rayonier Advanced Materials Inc. (RYAM): Price and Financial Metrics
RYAM Price/Volume Stats
| Current price | $6.36 | 52-week high | $6.37 |
| Prev. close | $6.18 | 52-week low | $2.66 |
| Day low | $6.10 | Volume | 491,500 |
| Day high | $6.37 | Avg. volume | 518,465 |
| 50-day MA | $5.54 | Dividend yield | N/A |
| 200-day MA | $4.31 | Market Cap | 417.06M |
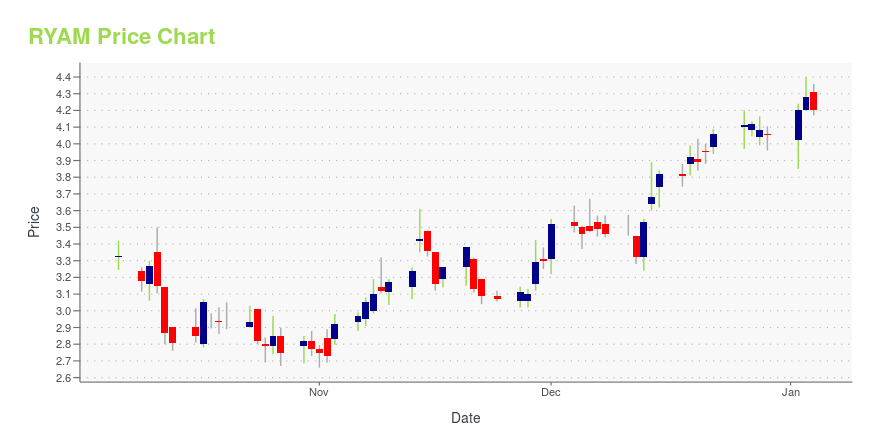
RYAM Stock Price Chart Interactive Chart >
Rayonier Advanced Materials Inc. (RYAM) Company Bio
Rayonier Advanced Materials is a supplier of high-purity, cellulose specialties natural polymers for the chemical industry for use in a wide range of industrial and consumer products such as filters, cosmetics and pharmaceuticals. The company was founded in 2014 and is based in Jacksonville, Florida.
Latest RYAM News From Around the Web
Below are the latest news stories about RAYONIER ADVANCED MATERIALS INC that investors may wish to consider to help them evaluate RYAM as an investment opportunity.
Sidoti Events, LLC's Virtual December Small-Cap ConferenceNEW YORK, NY / ACCESSWIRE / December 5, 2023 / Sidoti Events, LLC, an affiliate of Sidoti & Company, LLC, has released the presentation schedule and weblinks for its two-day December Small-Cap Conference taking place Wednesday and Thursday, December ... |
RYAM President and CEO to Present at Sidoti Virtual Investor ConferenceJACKSONVILLE, Fla., November 30, 2023--Rayonier Advanced Materials Inc. (NYSE: RYAM) (the "Company"), the global leader in High Purity Cellulose, today announced that President and Chief Executive Officer, De Lyle Bloomquist, is slated to speak at the Sidoti December Virtual Investor Conference, scheduled for December 7, 2023. |
Rayonier Advanced Materials Inc. (NYSE:RYAM) Q3 2023 Earnings Call TranscriptRayonier Advanced Materials Inc. (NYSE:RYAM) Q3 2023 Earnings Call Transcript November 8, 2023 Operator: Good morning, and welcome to the RYAM Third Quarter 2023 Earnings Conference Call. During today’s presentation, all parties will be in a listen-only mode. Following the presentation, the conference will be open for questions with instructions to follow at that time. […] |
Q3 2023 Rayonier Advanced Materials Inc Earnings CallQ3 2023 Rayonier Advanced Materials Inc Earnings Call |
RYAM Announces Third Quarter 2023 ResultsJACKSONVILLE, Fla., November 07, 2023--Rayonier Advanced Materials Inc. (NYSE:RYAM) (the "Company") reported a net loss of $25 million, or $(0.39) per diluted share, for the quarter ended September 30, 2023, compared to net income of $30 million, or $0.45 per diluted share, for the prior year quarter. Loss from continuing operations for the quarter ended September 30, 2023 was $27 million, or $(0.41) per diluted share, compared to income from continuing operations of $18 million, or $0.28 per di |
RYAM Price Returns
| 1-mo | 19.55% |
| 3-mo | 63.50% |
| 6-mo | 45.54% |
| 1-year | 33.05% |
| 3-year | -6.19% |
| 5-year | 35.61% |
| YTD | 57.04% |
| 2023 | -57.81% |
| 2022 | 68.13% |
| 2021 | -12.42% |
| 2020 | 69.79% |
| 2019 | -63.37% |
Continue Researching RYAM
Want to do more research on Rayonier Advanced Materials Inc's stock and its price? Try the links below:Rayonier Advanced Materials Inc (RYAM) Stock Price | Nasdaq
Rayonier Advanced Materials Inc (RYAM) Stock Quote, History and News - Yahoo Finance
Rayonier Advanced Materials Inc (RYAM) Stock Price and Basic Information | MarketWatch
Loading social stream, please wait...