
Rayonier Inc. (RYN): Price and Financial Metrics
RYN Price/Volume Stats
| Current price | $29.95 | 52-week high | $35.29 |
| Prev. close | $29.45 | 52-week low | $24.84 |
| Day low | $29.58 | Volume | 533,600 |
| Day high | $30.03 | Avg. volume | 595,010 |
| 50-day MA | $29.45 | Dividend yield | 3.91% |
| 200-day MA | $30.76 | Market Cap | 4.46B |
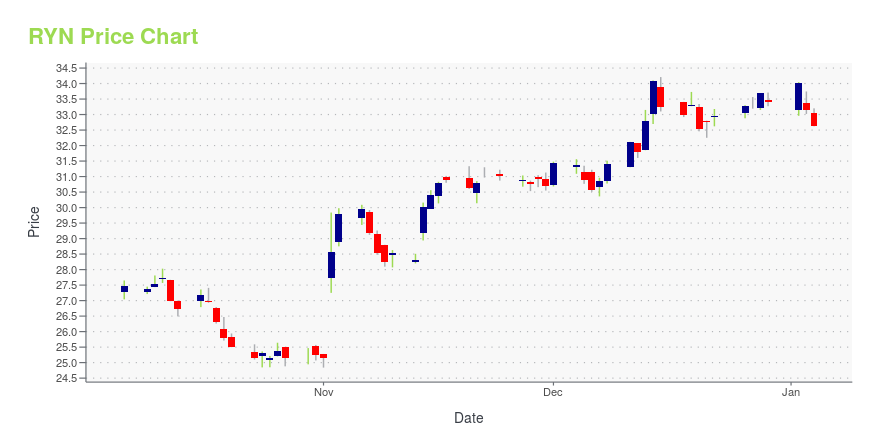
RYN Stock Price Chart Interactive Chart >
Rayonier Inc. (RYN) Company Bio
Rayonier Inc. engages in the sale and development of real estate and timberland management, as well as in the production and sale of cellulose fibers in the United States, New Zealand, and Australia. The company was founded in 1926 and is based in Jacksonville, Florida.
Latest RYN News From Around the Web
Below are the latest news stories about RAYONIER INC that investors may wish to consider to help them evaluate RYN as an investment opportunity.
Rayonier Provides Grants to 53 Nonprofit Organizations Supporting Nassau CountyOriginally published on Rayonier.com WILDLIGHT, FL / ACCESSWIRE / December 27, 2023 / Rayonier announced the award of $178,700 to 53 area organizations serving Nassau County. The company hosted its annual special awards breakfast on December 1st at ... |
5 big dividends & buybacks this week: AutoZone, RayonierHere is your Pro Recap of the biggest dividend hikes, special dividends, and share-buyback announcements you may have missed this week. AutoZone (NYSE:AZO) declared that its Board of Directors approved an additional $2.0 billion for the buyback of the company's common stock, as a part of its continuing share repurchase program. Since this program began in 1998, the Board of Directors has now authorized a total of $37.7B for stock repurchases. |
5 REITs Paying Special Dividends With Upcoming Ex-Dividend DatesAs much as investors love regular dividend payments, it's even more "special" when one of their stocks pays a special dividend, most often at the end of the calendar year. Because real estate investment trusts (REITs) are required to pay shareholders 90% or more of taxable income each year, special dividend distributions are often required when a REIT disposes of assets with large gains, which increases the taxable income for that year. The special dividend benefits shareholders with a larger an |
Rayonier SVP Named to International Forest Stewardship Coalition OfficeRayonier SVP Doug Long is among three directors named to global leadership positions. LONDON, UK / ACCESSWIRE / December 20, 2023 / After substantial participation at COP28 in Dubai, an expanding group of leading global sustainable forestry companies ... |
Rayonier (RYN) Completes the Oregon Timberland DivestitureRayonier (RYN) strategically divests Oregon timberland, aligning with its capital plans for enhanced shareholder value and long-term financial resilience. |
RYN Price Returns
| 1-mo | 3.78% |
| 3-mo | 0.25% |
| 6-mo | -1.30% |
| 1-year | -3.97% |
| 3-year | -11.59% |
| 5-year | 23.40% |
| YTD | -8.75% |
| 2023 | 5.76% |
| 2022 | -15.80% |
| 2021 | 41.56% |
| 2020 | -6.47% |
| 2019 | 22.65% |
RYN Dividends
| Ex-Dividend Date | Type | Payout Amount | Change | ||||||
|---|---|---|---|---|---|---|---|---|---|
| Loading, please wait... | |||||||||
Continue Researching RYN
Here are a few links from around the web to help you further your research on Rayonier Inc's stock as an investment opportunity:Rayonier Inc (RYN) Stock Price | Nasdaq
Rayonier Inc (RYN) Stock Quote, History and News - Yahoo Finance
Rayonier Inc (RYN) Stock Price and Basic Information | MarketWatch
Loading social stream, please wait...