Sabre Corporation (SABR): Price and Financial Metrics
SABR Price/Volume Stats
Current price | $3.68 | 52-week high | $7.92 |
Prev. close | $3.65 | 52-week low | $2.99 |
Day low | $3.66 | Volume | 1,454,097 |
Day high | $3.85 | Avg. volume | 6,454,574 |
50-day MA | $3.85 | Dividend yield | N/A |
200-day MA | $4.10 | Market Cap | 1.40B |
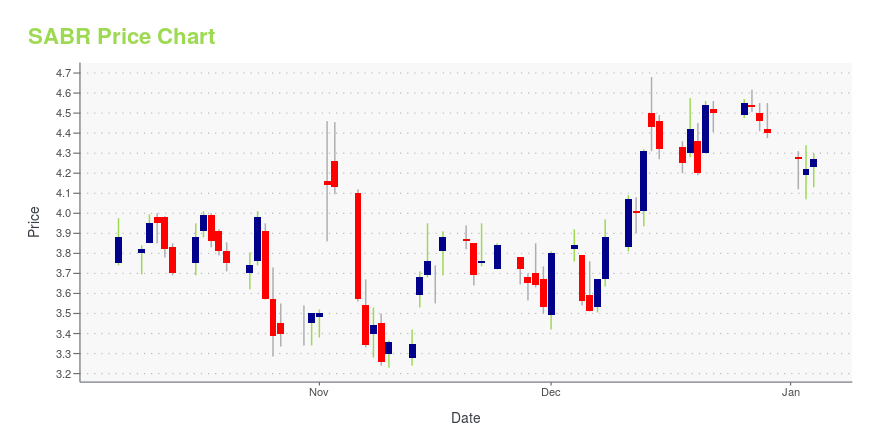
SABR Stock Price Chart Interactive Chart >
SABR POWR Grades
- SABR scores best on the Growth dimension, with a Growth rank ahead of 80.02% of US stocks.
- The strongest trend for SABR is in Momentum, which has been heading up over the past 177 days.
- SABR's current lowest rank is in the Sentiment metric (where it is better than 3.13% of US stocks).
SABR Stock Summary
- SABRE CORP's capital turnover -- a measure of revenue relative to shareholder's equity -- is better than merely 4.3% of US listed stocks.
- For SABR, its debt to operating expenses ratio is greater than that reported by 88.61% of US equities we're observing.
- Equity multiplier, or assets relative to shareholders' equity, comes in at -4.62 for SABRE CORP; that's greater than it is for just 3.55% of US stocks.
- Stocks with similar financial metrics, market capitalization, and price volatility to SABRE CORP are ATI, AIR, ZUMZ, SG, and ELSE.
- SABR's SEC filings can be seen here. And to visit SABRE CORP's official web site, go to www.sabre.com.
SABR Valuation Summary
- In comparison to the median Industrials stock, SABR's price/earnings ratio is 110.1% lower, now standing at -2.
- Over the past 116 months, SABR's price/sales ratio has gone down 0.9.
Below are key valuation metrics over time for SABR.
Stock | Date | P/S | P/B | P/E | EV/EBIT |
---|---|---|---|---|---|
SABR | 2023-11-09 | 0.4 | -1.0 | -2.0 | -36.6 |
SABR | 2023-11-08 | 0.5 | -1.0 | -2.1 | -37.1 |
SABR | 2023-11-07 | 0.4 | -1.0 | -2.1 | -36.9 |
SABR | 2023-11-06 | 0.5 | -1.0 | -2.2 | -37.4 |
SABR | 2023-11-03 | 0.5 | -1.2 | -2.6 | -38.9 |
SABR | 2023-11-02 | 0.6 | -1.2 | -2.6 | -38.9 |
SABR Growth Metrics
- Its 3 year revenue growth rate is now at -50.45%.
- The 2 year net income to common stockholders growth rate now stands at -478.62%.
- Its year over year net income to common stockholders growth rate is now at 51.88%.

The table below shows SABR's growth in key financial areas (numbers in millions of US dollars).
Date | Revenue | Operating Cash Flow | Net Income to Common Stock |
---|---|---|---|
2022-12-31 | 2,537.015 | -276.458 | -456.833 |
2022-09-30 | 2,406.473 | -321.272 | -483.438 |
2022-06-30 | 2,184.165 | -288.506 | -583.357 |
2022-03-31 | 1,946.301 | -356.334 | -641.905 |
2021-12-31 | 1,688.875 | -414.654 | -950.071 |
2021-09-30 | 1,501.952 | -591.328 | -1,069.172 |
SABR's Quality Factors
The “Quality” component of the POWR Ratings focuses on 31 different factors of a companies fundamentals and operational strength. Here are some key insights as we drill into the specifics of these quality attributes.- SABR has a Quality Grade of C, ranking ahead of 43.2% of graded US stocks.
- SABR's asset turnover comes in at 0.262 -- ranking 458th of 561 Business Services stocks.
- CSGP, TSRI, and MA are the stocks whose asset turnover ratios are most correlated with SABR.
The table below shows SABR's key quality metrics over time.
Period | Asset Turnover | Gross Margin | ROIC |
---|---|---|---|
2021-09-30 | 0.262 | -0.115 | -0.142 |
2021-06-30 | 0.224 | -0.214 | -0.156 |
2021-03-31 | 0.164 | -0.532 | -0.193 |
2020-12-31 | 0.219 | -0.301 | -0.203 |
2020-09-30 | 0.328 | -0.064 | -0.160 |
2020-06-30 | 0.459 | 0.083 | -0.091 |
SABR Price Target
For more insight on analysts targets of SABR, see our SABR price target page. And for a list of of all stocks sorted by upside potential based on analyst target price, see our Top Price Target page.
Average Price Target | $12.50 | Average Broker Recommendation | 1.92 (Hold) |
Sabre Corporation (SABR) Company Bio
Sabre Corporation provides technology solutions to the travel and tourism industry worldwide. It operates in two segments: Travel Network, and Airline and Hospitality Solutions. The company was founded in 2006 and is based in Southlake, Texas.
Latest SABR News From Around the Web
Below are the latest news stories about SABRE CORP that investors may wish to consider to help them evaluate SABR as an investment opportunity.
When Will Sabre Corporation (NASDAQ:SABR) Breakeven?We feel now is a pretty good time to analyse Sabre Corporation's ( NASDAQ:SABR ) business as it appears the company may... |
The 3 Most Undervalued Tech Stocks to Buy Now: November 2023Growth stocks are rallying but there are still bargains to be found. |
Sabre's (SABR) GDS to Provide LOT Polish Airlines' NDC ContentSabre (SABR) and LOT Polish Airlines enter into a partnership, wherein the Poland flag carrier's NDC content has been integrated into Sabre's GDS. |
Sabre (SABR) Renews Multi-Year Contract With lastminute.comSabre (SABR) renews a multi-year contract with one of Europe's largest online travel agencies, lastminute.com. |
LOT Polish Airlines' NDC content now available in Sabre's GDSLOT Polish Airlines and Sabre Corporation (NASDAQ: SABR), a leading software and technology provider that powers the global travel industry, today announced that the carrier's NDC offers are now available to travel agents worldwide through Sabre's global distribution system (GDS). With NDC, agents will have the opportunity to present the most competitive offer, personalized to the passenger's expectations. NDC offers are bookable through the Sabre Offer and Order APIs, agency booking solution, S |
SABR Price Returns
1-mo | 6.67% |
3-mo | -26.40% |
6-mo | 6.05% |
1-year | -36.33% |
3-year | -68.55% |
5-year | -84.74% |
YTD | -40.45% |
2022 | -28.06% |
2021 | -28.54% |
2020 | -44.95% |
2019 | 6.32% |
2018 | 8.06% |
Continue Researching SABR
Here are a few links from around the web to help you further your research on Sabre Corp's stock as an investment opportunity:Sabre Corp (SABR) Stock Price | Nasdaq
Sabre Corp (SABR) Stock Quote, History and News - Yahoo Finance
Sabre Corp (SABR) Stock Price and Basic Information | MarketWatch
Loading social stream, please wait...